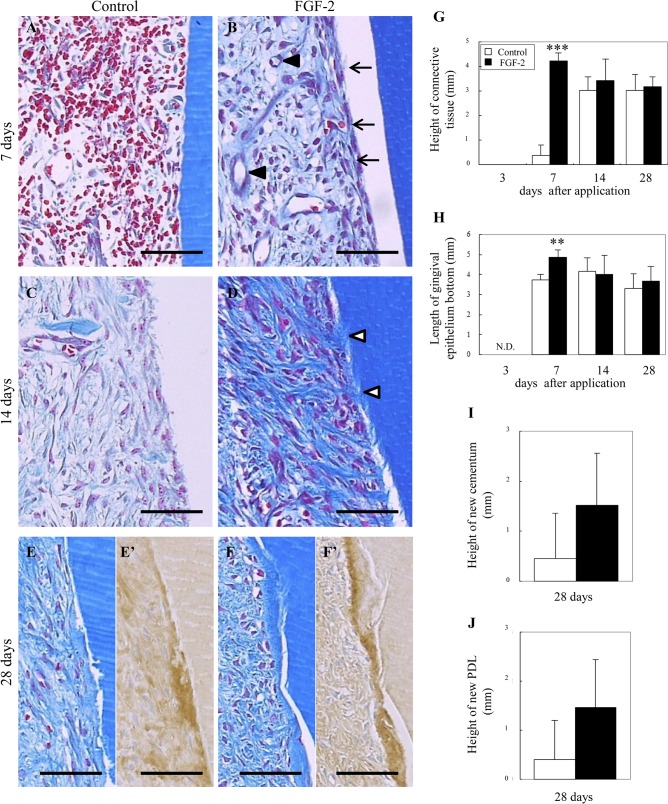
Fig 2. Histology of the regenerated tissue on the root surface.
(A–F): Representative photomicrographs from control (A, C, E) and FGF-2 (B, D, F) groups are shown at 7 days (A, B), 14 days (C, D) and 28 days (E, F). Immunostaining of collagen type 1 in E and F are shown in E’ and F’. Arrow, thickly lined by the fibroblastic cells; black arrowhead, neovessel; white arrowhead, Sharpey’s fiber. Scale bar represents 50 μm. (G–J): Histological analysis of tissue regeneration on the root surface. (G): Height of the newly connective tissue from the defect bottom. (H): Length of the gingival epithelium from the defect bottom. N.D., no gingival tissue contacted the root surface. (I, J): Height of the new cementum and PDL from the defect bottom at 28 days. All results are presented as the mean ± SD (n = 4) (**, p<0.01; ***, p <0.001 compared with the control, t-test).

