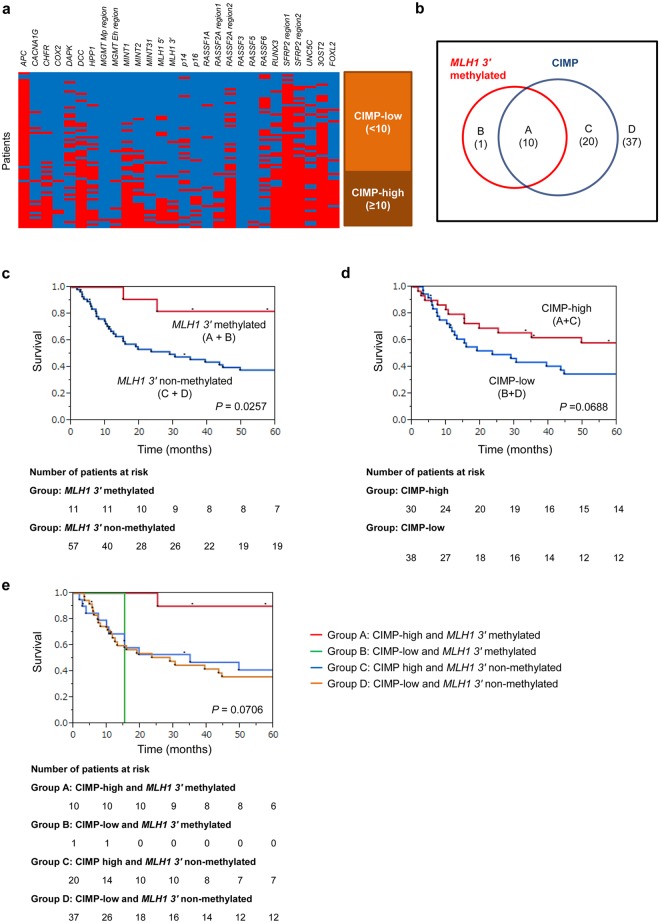
Fig 1. Relationship between CIMP and MLH1 methylation.
a) Tile map showing methylation pattern. Twenty eight loci (APC, CACNA1G, CHFR, COX2, DAPK, DCC, HPP1, MGMT-Mp region, MGMT-Eh region, MINT1, MINT2, MINT31, MLH1 5', MLH1 3', p14, p16, RASSF1A, RASSF2A-region1, RASSF2A-region2, RASSF3, RASSF5, RASSF6, RUNX3, SFRP2-region1, SFRP2-region2, UNC5C, 3OST2, FOXL2) were analyzed to determine CIMP status. Thirty patients with not less than ten methylated loci were identified as the CIMP-high group. b) Venn diagram showing the overlap of MLH1 3' methylation and CIMP status. The overlapping relationship between MLH1 3' methylation and CIMP status was analyzed. 10 patients were in the combined in the CIMP-high/MLH1 3' methylated (A), 1 patients were in the CIMP-low/MLH1 3' methylated (B), 20 patients were in the CIMP high/MLH1 3' non-methylated (C), and 37 patients were in the CIMP-low/MLH1 3' non-methylated groups (D). c) Kaplan–Meier estimate of OS in patients with MLH1 3' methylated or non-methylated gastric cancers. Kaplan–Meier survival curves were generated according to MLH1 3' methylation status. The 5-year survival rates were analyzed for the MLH1 3' methylated and non-methylated groups. The survival rate was significantly higher in the MLH1 3' methylated group than in the non-methylated group (log-rank P = 0.0257). d) Kaplan–Meier estimate of OS in patients with CIMP-high or CIMP-low gastric cancers. Kaplan–Meier survival curves were generated according to CIMP status. The 5-year survival rate was analyzed for the CIMP-high group and CIMP-low group. The survival rate was slightly higher in the CIMP-high group than in the CIMP-low group, but the difference was not significant (log-rank P = 0.0688). e) Contribution of CIMP and mismatch repair deficiency status to survival rate. Kaplan–Meier survival curves were generated according to CIMP and MLH1 methylation status. The patients were classified on the basis of combined CIMP status and MLH1 methylation status into the CIMP-high/MLH1 3' methylated (A), CIMP-low/MLH1 3' methylated (B), CIMP high/MLH1 3' non-methylated (C), and CIMP-low/MLH1 3' non-methylated groups (D). Overall survival rates were higher in the combined CIMP-high/MLH1 3' methylated group, compared to the other groups where the differences were not statistically significant (log-rank P = 0.0706).

