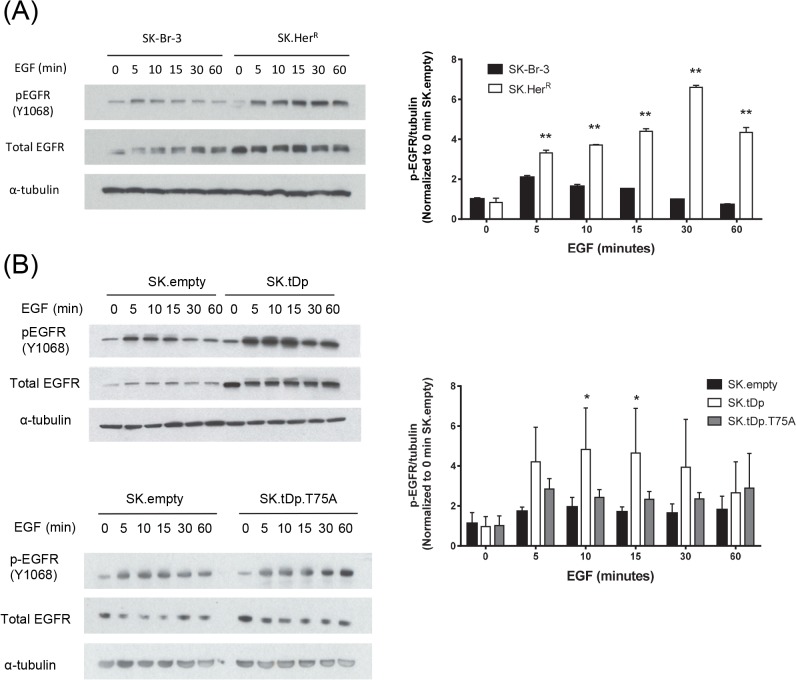
Fig 5. Increased EGFR activation in cells over-expressing t-Darpp.
Western analysis (left) and quantification (right) of cells serum-starved overnight (16 hours) followed by 100 ng/ml EGF stimulation for the indicated time points. α–tubulin was used as a loading control. Protein expression was quantified using the ImageJ software. p-EGFR data was normalized to α–tubulin in each lane and represented as the fold change relative to the zero time point p-EGFR signal for the SK-Br-3 or SK.empty cell line. (A) SK-Br-3 and SK.HerR cells (B) SK.empty, SK.tDp and SK.tDp-T75A cells. *, p <0.05; **, p<0.01.

