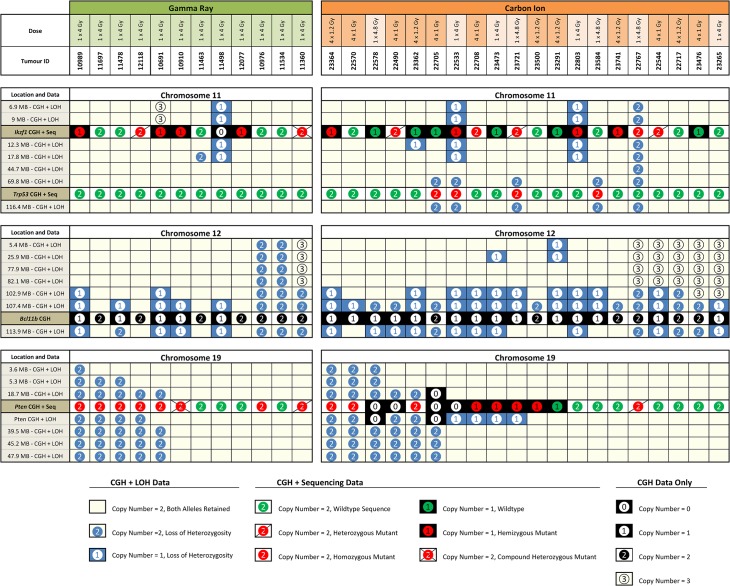
Fig 3. Combined DNA copy number information, loss or retention of heterozygosity and mutation screening.
Data for chromosomes 11, 12 and 19, from twelve G-TL and twenty C-TL are shown. Each column represents a single tumour down through all three panels. Columns are ordered manually based on observed groupings. Each row represents either LOH and DNA copy number (CGH) data, DNA copy number data only (Bcl11b locus) or DNA copy number and mutation data (Ikzf1, Trp53 and Pten loci). Locations noted in each row are from GRCm38 positioning.

