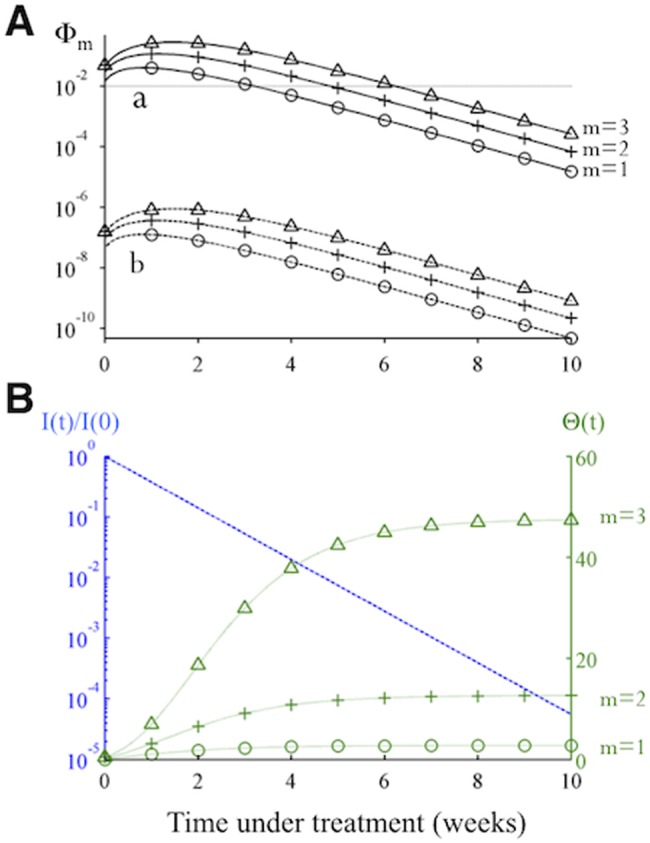
Fig 3. There is a high-risk window early in treatment when missing doses is more likely to cause de novo resistance.

(A) The changes in the risk of de novo resistance, Φm, generated by a partially resistant mutant over time. The two sets of trajectories, A and B, differ in that the value of μ eff for trajectory B is smaller by a factor of 10–5 (representing one additional nucleotide mutation) than the value set for trajectory A. Each set of trajectories shows the risk when the number of doses missed (m) is 1,2 or 3. (B) Dynamics of the two time-varying quantities in Eq 4, i.e. the number of cells infected by the partially resistant mutant relative to the initial number before treatment (I(t)/I(0); blue dashed line), and the value of Θ(t), green dotted lines, as shown in Eq 4. Under effective treatment, the number of infected cells I(t) decreases exponentially, while the number of target cells rebounds to the infection-free level quickly, causing an increase in Rave,m and thus Θ(t). Together these changes cause Φm to increase initially and then to decrease exponentially at longer times (as seen in panel A).
