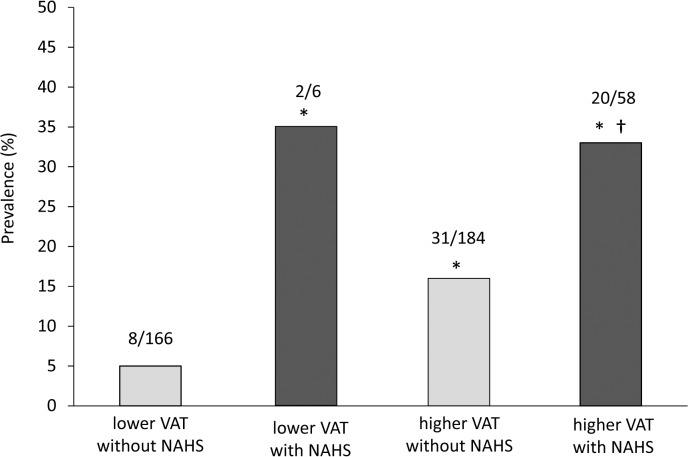
Fig 4. Prevalence of high-risk plaques according to presence or absence of nonalcoholic hepatic steatosis and the VAT area in the patients.
The number of patients with high-risk plaques and total number of patients in each group is given above each bar. * p<0.05 vs. subjects without nonalcoholic hepatic steatosis with lower VAT. † p<0.05 vs. subjects without nonalcoholic hepatic steatosis with higher VAT. NAHS, nonalcoholic hepatic steatosis.

