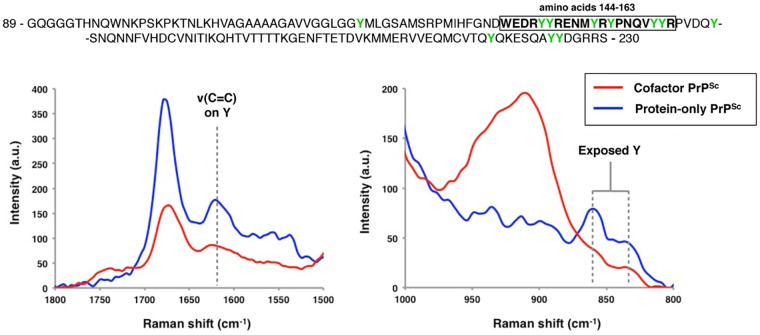
Fig 4. Raman spectroscopy of cofactor and protein-only PrPSc, focusing on spectral regions assigned to tyrosine side chains.
The primary sequence of the region examined by DXMS is shown, with residues 144–163 boxed and tyrosine residues highlighted in green. Raman shifts corresponding to the ν(C = C) ring mode (~1620 cm-1) and the tyrosine Fermi-doublet (~850 and 830 cm-1) are shown.

