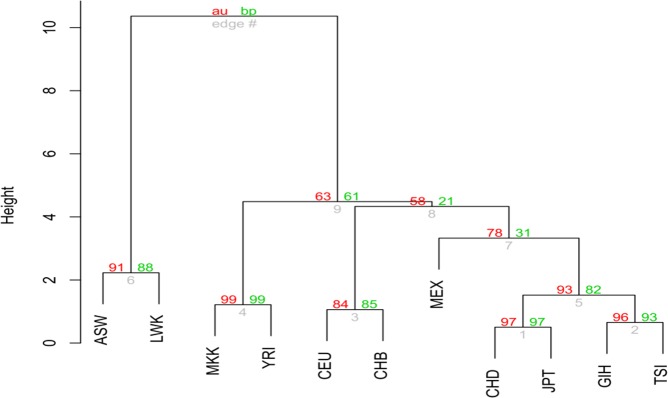
Fig 4. Cluster analysis of eleven human populations.

The plot is based on the total significant zygotic and composite digenic LDs (Table 1), the average r-squares (Table 2), the average physical distances (Table 3), and Pearson’s correlations between the significant r-square and the physical distance (Table 4). Information on d (>0 or <0) is excluded in all tables. Distance matrix is constructed using Canberra distance between any two vectors (20-dimensional). The numbers in red are the p-values (out of 100) that are approximately unbiased (AU), and the numbers in green are the p-values (out of 100) derived from bootstrapping (BP).
