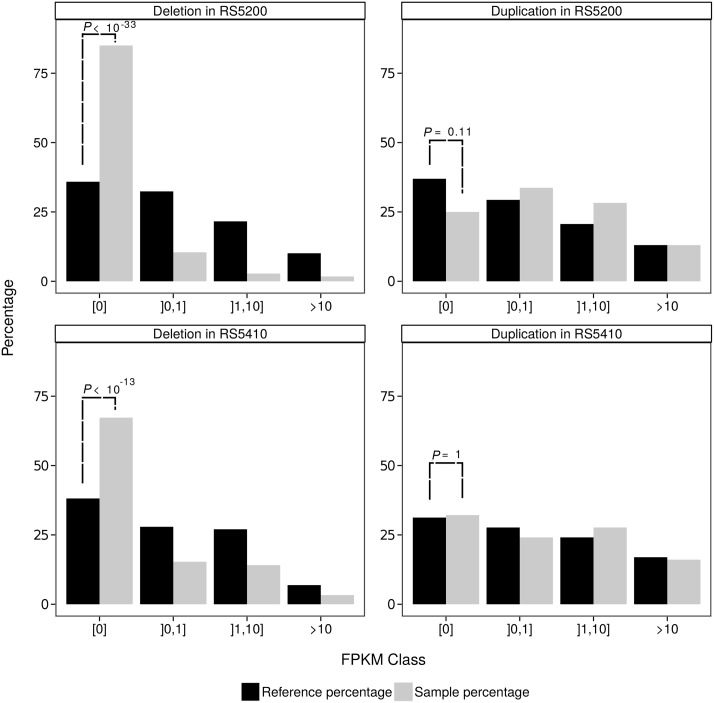
Fig 3. Effect of duplications and deletions on gene expression levels.
Distribution of expression categories of duplicated and deleted genes for the reference strain and the strain of interest. Only genes within perfectly collinear regions between the reference genome and the sister species were used for this analysis. While deletions lead to a strong increase in genes without expression, i.e. more than 80% (RS5200) and 65% (RS5410) of genes in predicted deletions show indeed no evidence of expression. In contrast, we do not see the opposite trend for duplicated genes.

