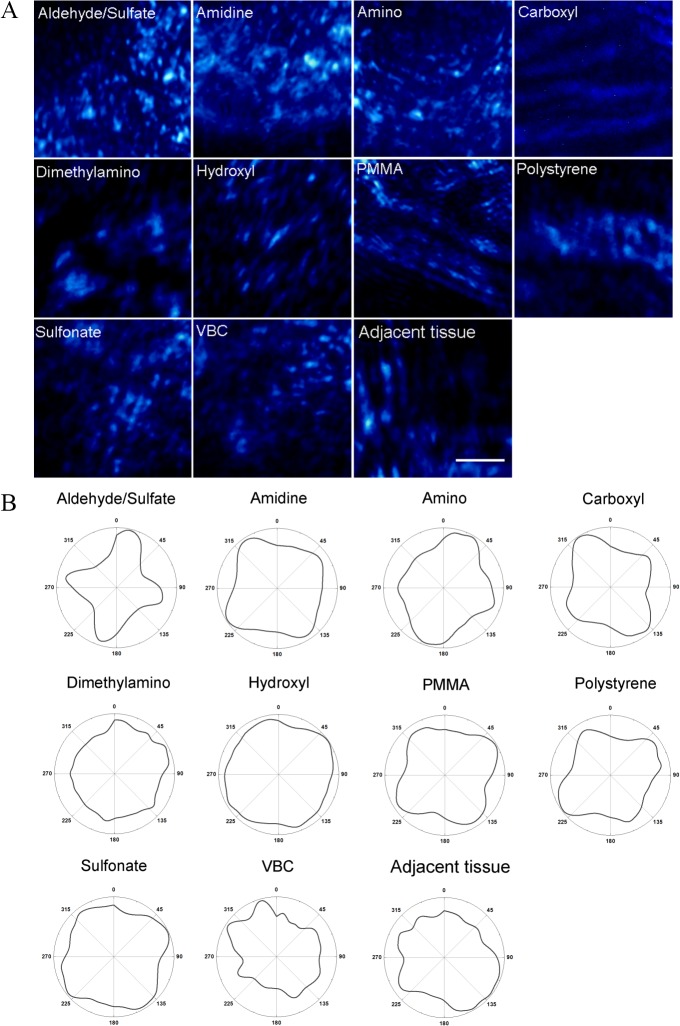
Fig 3.
A) Representative SHG images of the fibrotic capsule in tissue section with different subcutaneously implanted polystyrene particles. SHG intensity is in blue pseudocolor. The scale bar represents 20μm. B) SHG polarimetry profiles for tissue sections with on different latex beads. The y-axis corresponds to SHG intensity in arbitrary units and the azimuthal angles correspond to polarization angles.

