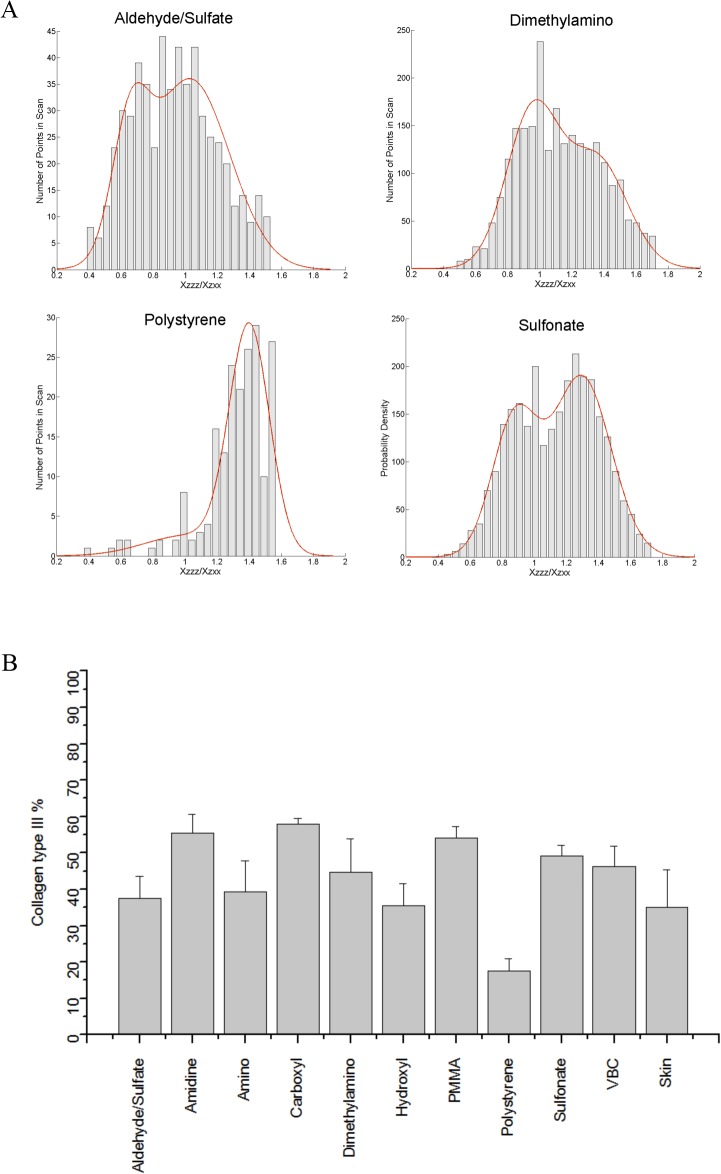
Fig 5.
A) Histograms of values obtained for tissue sections of subcutaneously implanted aldehyde/sulfate, amidine, amino and dimethylamino polystyrene particles. The bars represent experimentally acquired data. The red line is the bimodal Gaussian fit to the data. B) Collagen type III content of fibrotic capsules surrounding subcutaneously implanted polystyrene particles.

