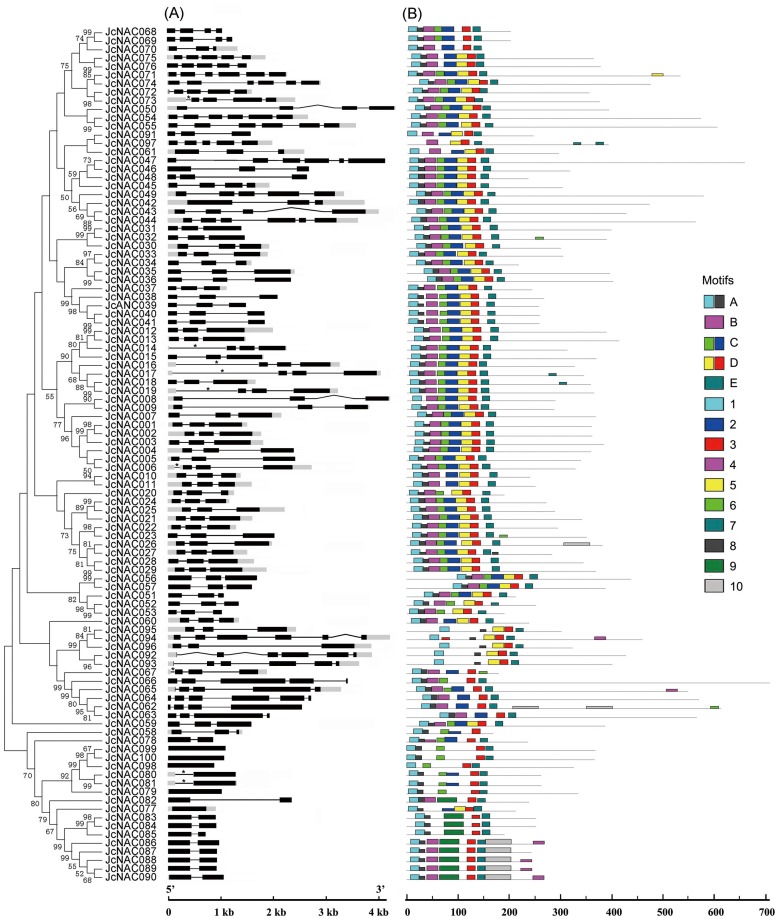
Fig 1. Gene structure and motif locations of JcNAC genes.
(A), Exon/intron arrangements of JcNAC genes. Exons and introns are represented by black boxes (open reading frame in black, untranslated region (UTR) in gray), and black lines, respectively, and their sizes are indicated by the scale at the bottom. *, intron in the UTR. (B), Schematic representation of conserved motifs in the JcNAC proteins predicted by MEME. Each motif is represented by a number in the colored box. The black lines represent non-conserved sequences. The relationships between motifs and conserved domains (A-E) are shown on the right. The lengths of JcNAC proteins can be estimated from the scale at the bottom.

