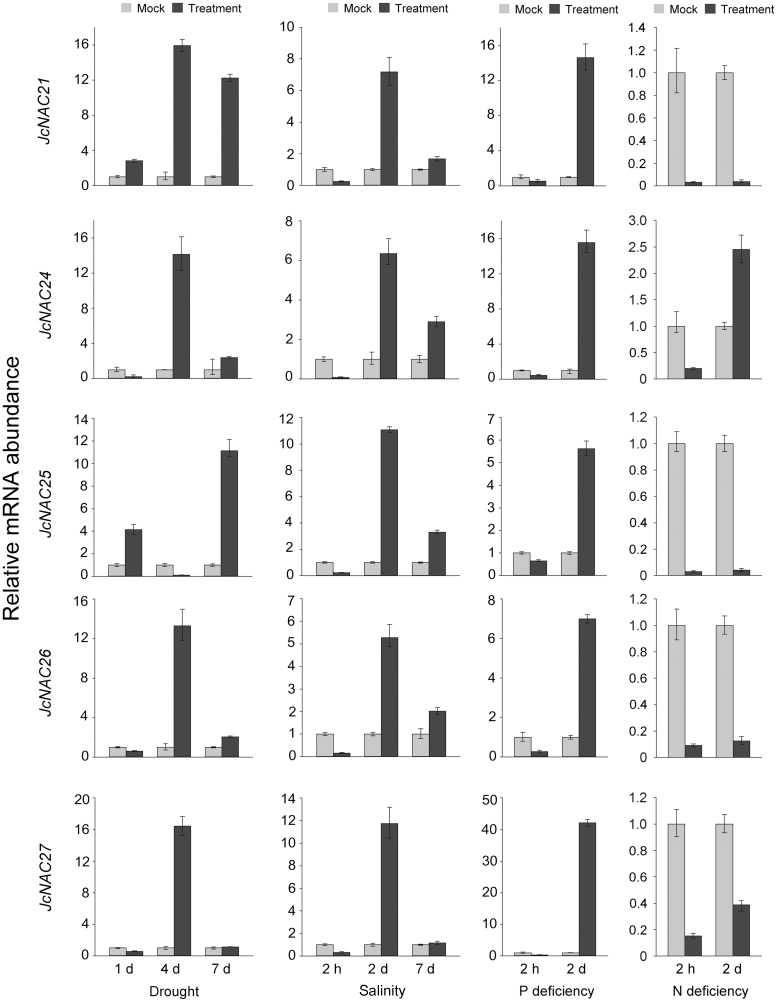
Fig 5. Expression analysis of selected JcNAC genes.
Results of quantitative PCR analysis of transcripts in roots, the expression level of each gene under common condition sampled as mock. The relative expression was normalized to the reference gene JcActin as an internal control. The bars show standard deviations of the repeats. Each assay was run in triplicate for two independent biological repeats.

