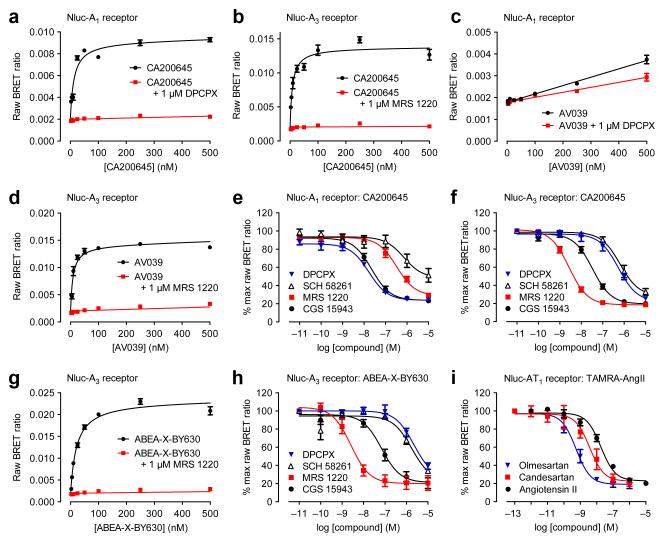
Figure 2.
Extending use of NanoBRET. (a,b) We treated Nluc-A1 (a) and Nluc-A3 (b) with increasing CA200645 concentrations with non-specific binding established with 1 μM DPCPX for Nluc-A1 (a) and 1 μM MRS 1220 for Nluc-A3 (b). (c,d) We observed a specific saturable signal in Nluc-A3 (d) cells but not in Nluc-A1 (c) cells treated with increasing AV039 concentrations in the presence of 1 μM MRS 1220 (d) or 1 μM DPCPX (c). In (c), the only statistically significant difference was at 250 nM AV039 (two-way ANOVA; p<0.05). (e,f) We treated Nluc-A1 (e) and Nluc-A3 (f) cells with 25 nM CA200645 and increasing unlabeled ligand concentrations. (g) We generated saturation BRET binding curves for binding fluorescent agonist ABEA-X-BY630 to Nluc-A3 in absence or presence of 1μM MRS 1220. (h) We monitored the ability of increasing concentrations of DPCPX, SCH 58261, MRS 1220 and CGS 15943 to decrease Nluc-A3 to ABEA-X-BY630 BRET. (i) We treated Nluc-AT1 with 1 μM TAMRA-AngII and increasing concentrations of angiotensin II, candesartan and olmesartan. We measured BRET after furimazine addition. Panels a, b, c, d and g are representative of four experiments (in triplicate; error bars are s.e.m. of triplicate points). Data in e, f, h and i represent mean ± s.e.m. of three experiments (in duplicate; i) or four experiments (in triplicate; e, f, h). Exceptions are DPCPX in (e) which is mean ± s.e.m. of five experiments (in triplicate) and MRS1220 in (f) which is mean ± s.e.m. of three experiments (in triplicate).

