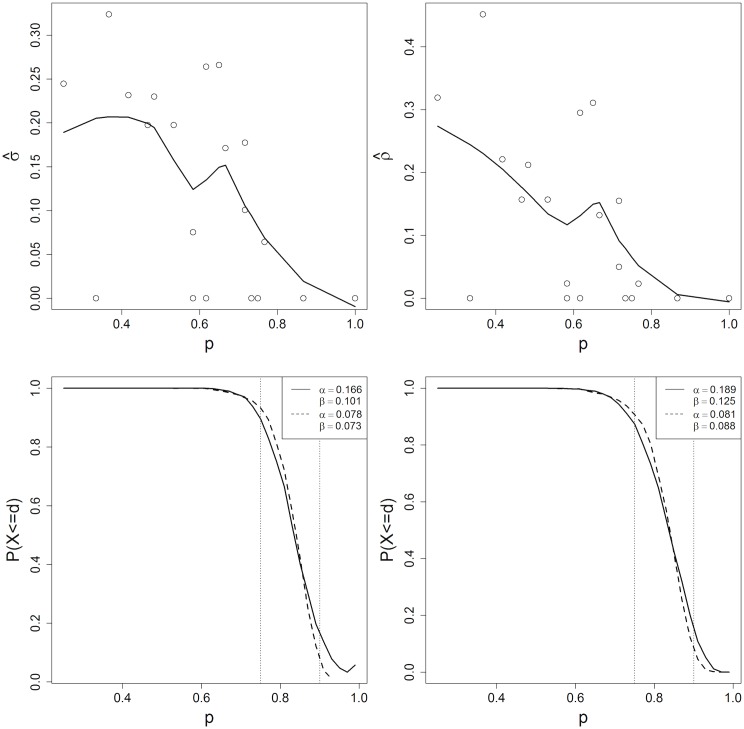
Fig 4. Top panel: Estimated σ and ρ as a function of for 20 areas in Greenland et. al [12], with loess smooth overlayed.
Bottom panel: Solid line represents OC curve for n = 60, d = 50 for p l = .75, p u = .9 design when σ and ρ are fixed at the mean value of (left) and (right). Dashed line represents OC curve when σ and ρ vary over p according to the predicted loess smooth of (left) and (right).

