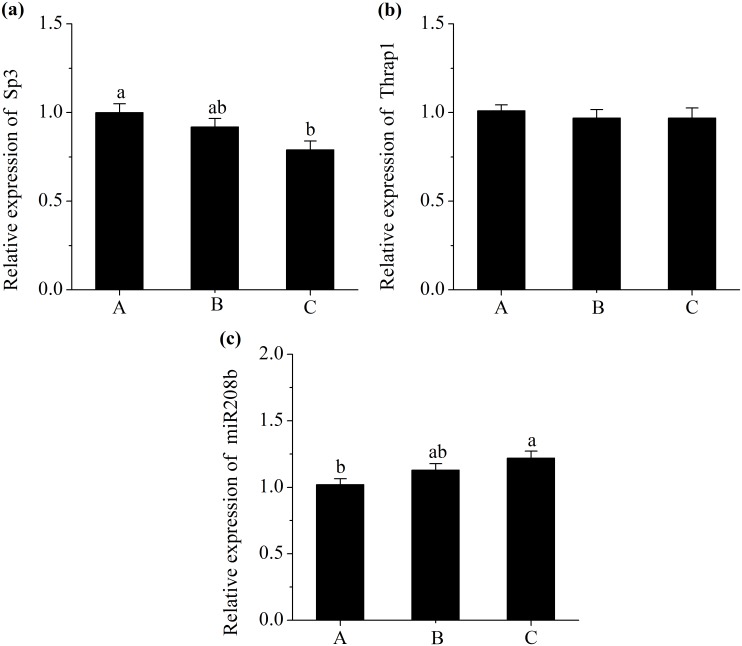
Fig 4. Relative mRNA expression of specificity protein 3 (Sp3) (a), Relative mRNA expression of thyroid hormone receptor associated protein 1 (Thrap1) (b) and Relative miRNA expression of miR208b (c).
Diet A contained 44.1% starch, diet B contained 37.6% starch and diet C contained 30.9% starch. mRNA expression was normalized to 18s rRNA gene expression. miRNA expressions were normalized to UniSp6 expression. Data were shown as the mean ± standard error of eight replicates. a,bMean values within different letters were significantly different (P<0.05).

