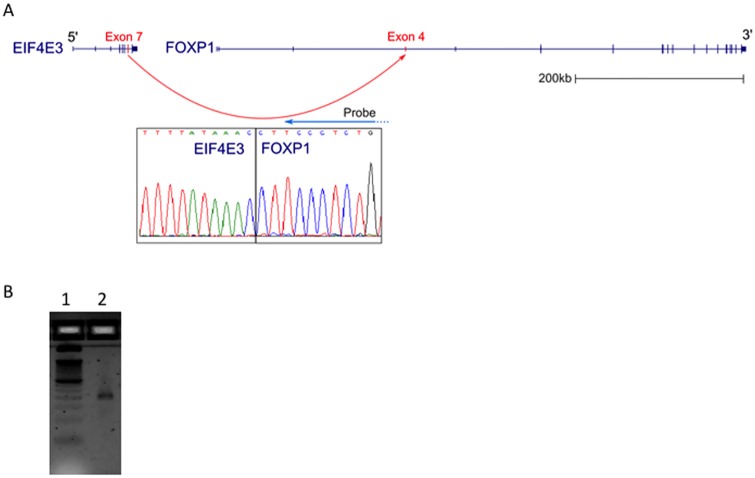
Fig 3. EIF4E3-FOXP1 fusion transcript.
(A) Structure of the fusion transcript based on UCSC genome browser tracks. Red arrow indicates the in frame fusion of EIF4E3 exon7 to FOXP1 exon 4. The Sanger sequencing trace below indicates the sequence of the fusion point, while the blue arrow over the sanger sequence trace indicates the 3’ end of the targeting probe. (B) RT-PCR result using PCR primers indicated described in S2 for detecting this fusion transcript. Lane 1: RT-PCR product showing the correct 209bp size, Lane 2: 50bp ladder.

