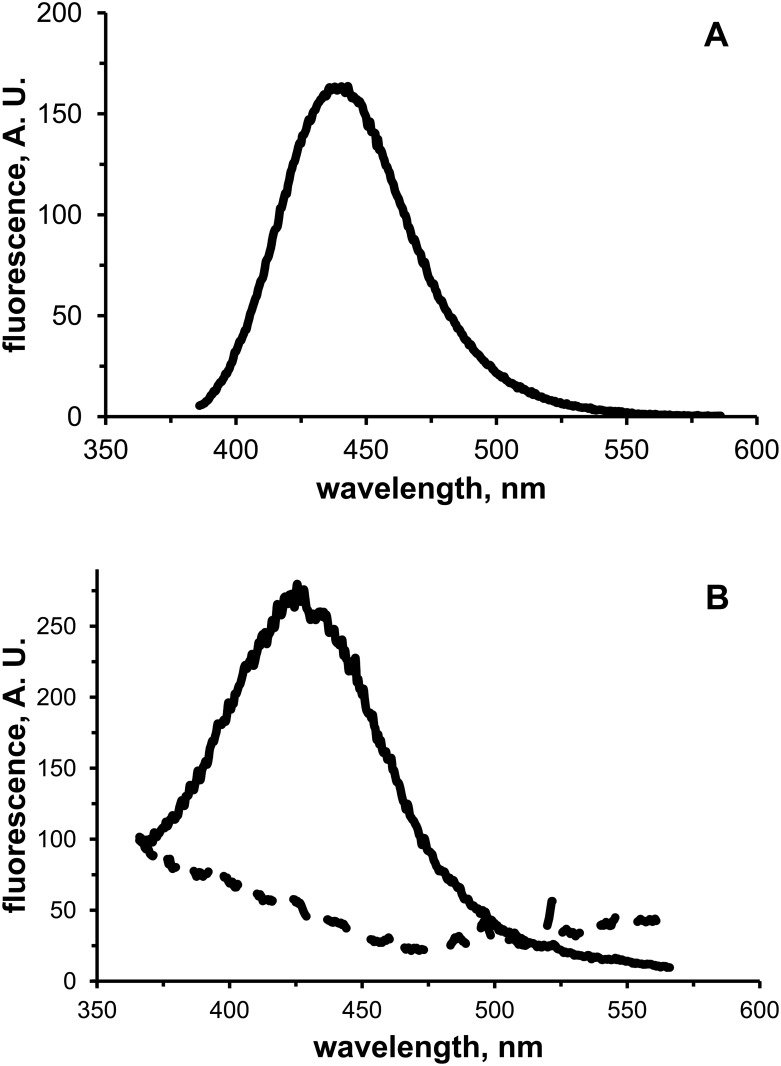
Fig 8. Fluorescence analysis of matrix functionalization.
A) Emission spectrum (λexc 380 nm) of 5 mM p-ACA in 0.4 M NaHCO3, 1 M NaCl (pH 8,3). B) Emission spectra (λexc 350 nm) of suspensions of p-ACA/matrix (50 μl, drained volume; solid line) and EA/matrix (50 μl, drained volume; dashed line) in 2 mL of 0.4 M NaHCO3, 1 M NaCl (pH 8,3). A. U., arbitrary units.

