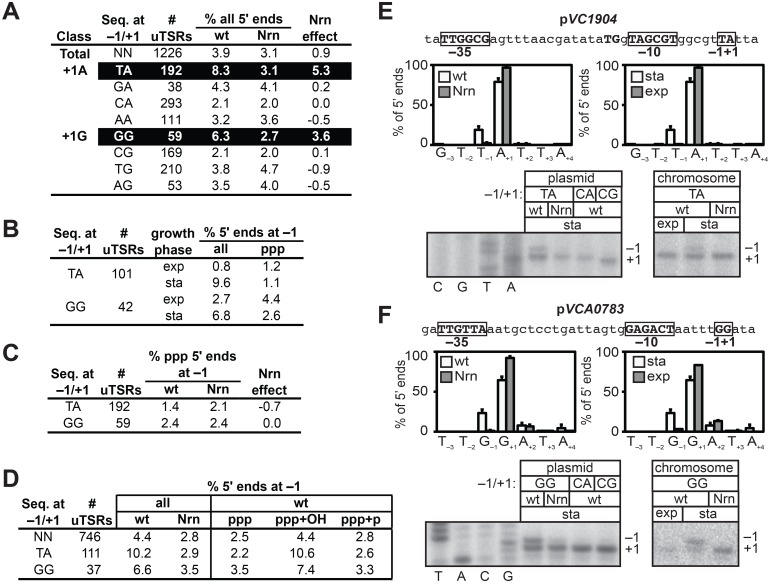
Fig 3. Detection of PDI in V. cholera.
A-D. Analysis of PDI by 5′ RNA-seq. Percentage of transcripts emanating from position −1 of uTSRs (S2 and S3 and S4 Tables) with the indicated sequence at −1 and +1 in cells carrying wild-type concentrations of 2- to ~4-nt RNAs (wild-type) or cells in which the oligoRNase NrnB was ectopically expressed (Nrn). The Nrn effect reported in panels A and C represents the difference in these values. uTSRs with above average Nrn effect are highlighted in black. The total number of uTSRs used to calculate the percentages is indicated. Values in panels A and B are calculated from biological replicates listed in S2 Table, values in panel C is calculated from replicates listed in S3 Table and values in panel D are calculated from replicates listed in S4 Table. exp, exponential phase; sta, stationary phase; all, analysis of all 5′ ends; ppp, analysis of 5′ triphosphate ends; ppp+OH, analysis of 5′ triphosphate ends and 5′ hydroxyl ends; ppp+p, analysis of 5′ triphosphate ends and 5′ monophosphate ends. E. and F. Analysis of PDI at the promoters associated with VC1904 (pVC1904) and VCA0783 (pVCA0783). Top of each panel shows promoter sequence. Indicated are positions +1, −1 and the promoter −10 and −35 elements. Middle of each panel shows results of 5′ RNA-seq. Graphs on left show average distribution of all 5′ ends between positions −3 and +4 in cells carrying wild-type concentrations of 2- to ~4-nt RNAs (wt) or cells in which the oligoRNase NrnB was ectopically expressed (Nrn) as detected by 5′ RNA-seq during stationary phase. Graphs on the right show average distribution of all 5′ ends between positions −3 and +4 for pVCA0783 in wild-type cells during stationary phase (sta) or exponential phase (exp). Bottom of each panel shows primer extension analysis of plasmid-borne promoter variants carrying the indicated sequences at positions −1/+1 (left) or primer extension analysis of chromosomally encoded promoters during exponential phase (exp) or stationary phase (sta).

