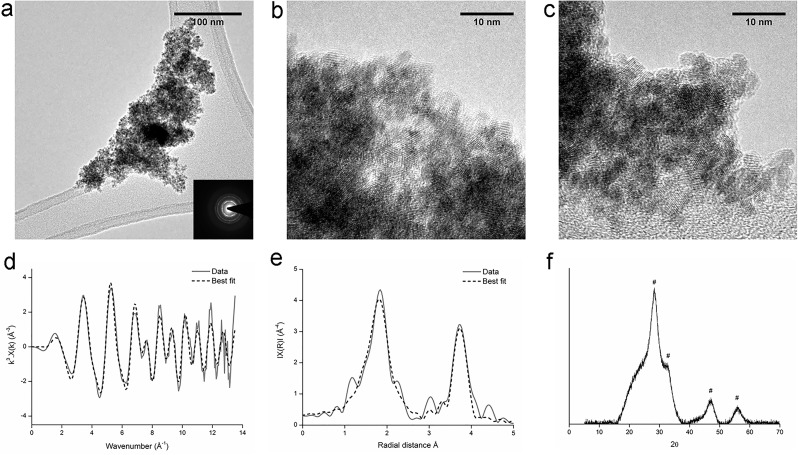
Fig 5. Microbial U(VI)aq reduction experiment: TEM images (a, b, c), k3 weighted EXAFS data (d), non-phase shift corrected Fourier transform of EXAFS data (e), and XRD spectra (f).
Dashed lines in XAS spectra represent the best fit of the data. # are peaks from uraninite (S6 Fig shows the peak pattern). Experiments were conducted in a bicarbonate buffer with glycerol as the electron donor and U(VI)aq as the electron acceptor. Results confirmed the precipitate to be nanocrystalline uraninite.

