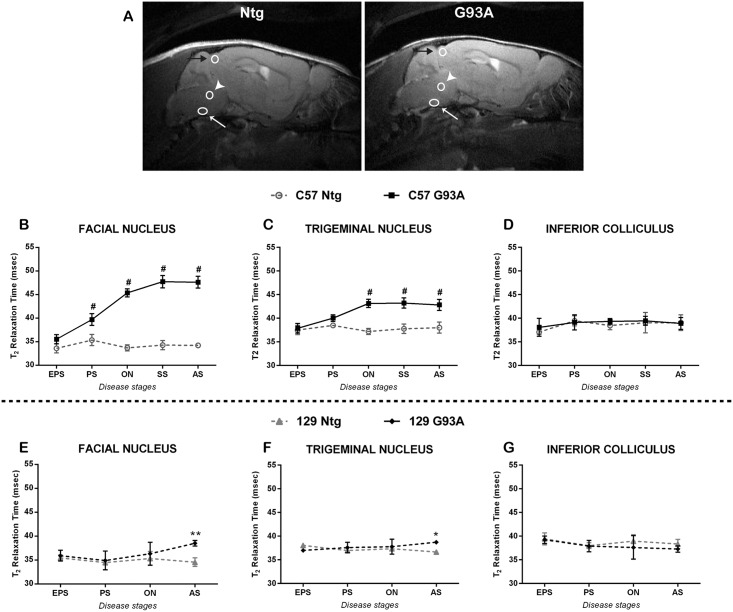
Fig 2. T2 relaxation time of brainstem nuclei of SOD1G93A mice at different stages of the disease.
(A) Representative T2-weighted images are shown from a SOD1G93A (G93A) and a non-transgenic (Ntg) mouse. The ROIs correspondent to facial nuclei are indicated by a white arrow, to the trigeminal nuclei are indicated by a white arrowhead and to the inferior collliculi are indicated by a black arrow. T2 relaxation times of facial (B, E) and trigeminal (C, F) nuclei and of inferior colliculus (D, G) have been analyzed in C57 (B, C, D) and 129Sv (E, F, G) mice. SOD1G93A and non-transgenic mice have been compared during the progression of the disease for each strain. EPS = early pre-symptomatic stage, PS = pre-symptomatic stage, ON = Onset, SS = Symptomatic stage, AS = advanced stage. Data are expressed as mean ± SD. Statistical analysis: Two-way ANOVA, followed by Bonferroni’s post-hoc test. Facial nucleus: in C57 mice genotype [F (1,7) = 623.8, p<0.0001], stage [F (4,28) = 52.82, p<0.0001] and interaction [F (4,28) = 52.86, p<0.0001], while in 129Sv genotype [F (1,6) = 14.52, p = 0.0089], stage [F (3,18) = 2.481, p = 0.0939] and interaction [F (3,18) = 2.869, p0.0652]. Trigeminal nucleus: in C57 mice genotype [F (1,7) = 72.81, p<0.0001], stage [F (4,28) = 15.99, p<0.0001] and interaction [F (4,28) = 18, p<0.0001]. Inferior Colliculus: genotype [F (1,7) = 0.5181, p = 0.495], stage [F (4,28) = 2.329, p = 0.0806] and interaction [F (4,28) = 0.4251, p = 0.7892], while in 129Sv genotype [F (1,6) = 4.081, p = 0.0899], stage [F (3,18) = 0.5146, p = 0.6774] and interaction [F (3,18) = 3.294, p = 0.0443]. Stars indicate: * = p-value<0.05, ** = p-value<0.01, # = p-value<0.001. 6–5 animals in the SOD1G93A and 3 animals in the Ntg groups.

