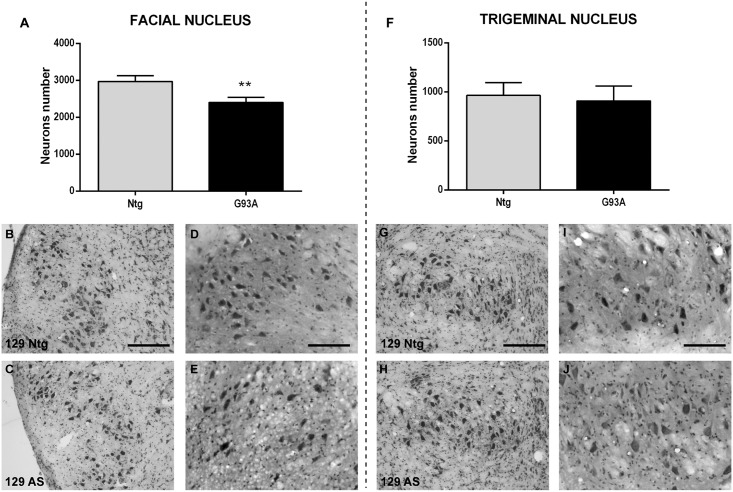
Fig 4. Evaluation of cranial neuron number and their vacuolization in 129Sv SOD1G93A mice and non-transgenic littermates.
Facial (A-E) and trigeminal (F-J) nuclei have been analyzed by Nissl (B-C, G-H) and H&E (D-E, I-J) staining to quantify brainstem neurons and to detect vacuolization, respectively. (A) Neuronal cell count of facial nucleus of 129Sv SOD1G93A mice at the advanced stage of the disease and relative non-transgenic littermates. (B-C) Nissl staining microphotographs of the facial nucleus of non-transgenic (Ntg, B) and SOD1G93A (C) 129Sv mice at the advanced stage of the disease. (D-E) H&E staining microphotographs of the facial nucleus of non-transgenic (Ntg, D) and SOD1G93A (E) 129Sv mice at the advanced stage of the disease. (F) Neuronal cell count of trigeminal nucleus of 129Sv SOD1G93A mice at the advanced stage of the disease and relative non-transgenic littermates. (G-H) Nissl staining microphotographs of the trigeminal nucleus of non-transgenic (Ntg, G) and SOD1G93A (H) 129Sv mice at the advanced stage of the disease. (I-J) H&E staining microphotographs of the trigeminal nucleus of non-transgenic (Ntg, I) and SOD1G93A (J) 129Sv mice at the advanced stage of the disease. Scale bar represents 100 μm in Nissl microphotographs (B-C, G-H) and 200 μm in H&E microphotographs (D-E, I-J). AS = advanced stage. The total neuron number was obtained multiplying the raw counts by four to give an estimate of the total cell number in the nucleus. Data are expressed as mean ± SD. Statistical analysis: Student’s t-test. ** p-value<0.01 between SOD1G93A and respective Ntg littermates. 4 animals for each group.

