Fig. 4.

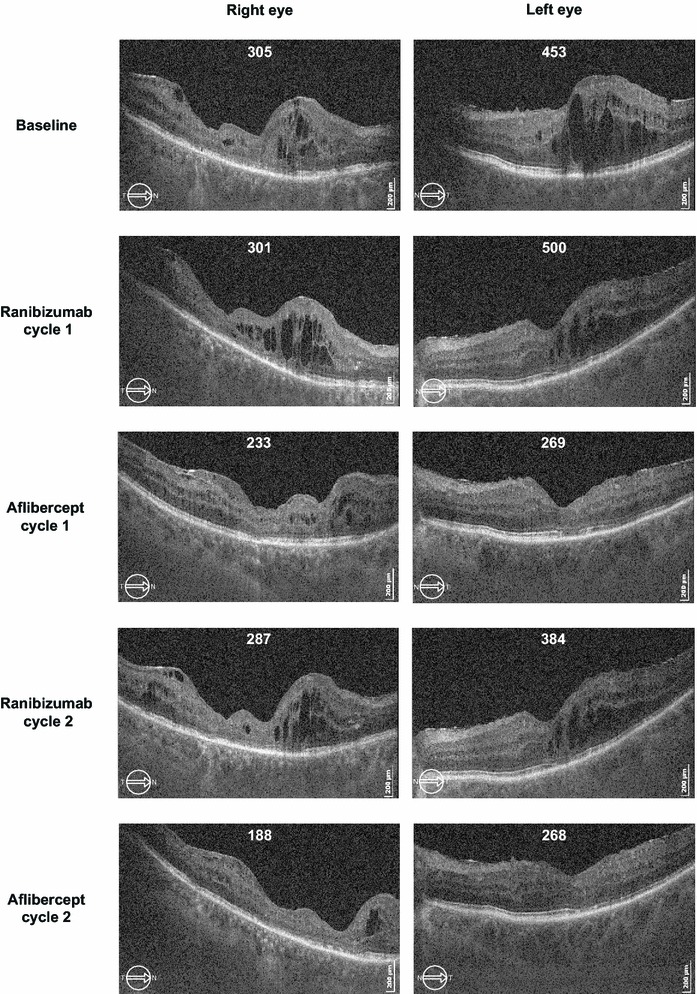
Successive ocular coherence tomography (OCT) of horizontal sections (7.0 mm) from the right and left eyes shows the evolution of subretinal and intraretinal fluid. Central foveal thickness (μm) is indicated for each OCT exam. Images correspond to the OCT scans taken 4 weeks after the last (third) injection of each treatment cycle. Baseline image was taken after a 1-month washout period after the prestudy treatment (near-monthly ranibizumab injections). Clear improvement is observed during the two aflibercept treatment cycles, whereas worsening is observed during the two ranibizumab treatment cycles. CFT Central Foveal Thickness
