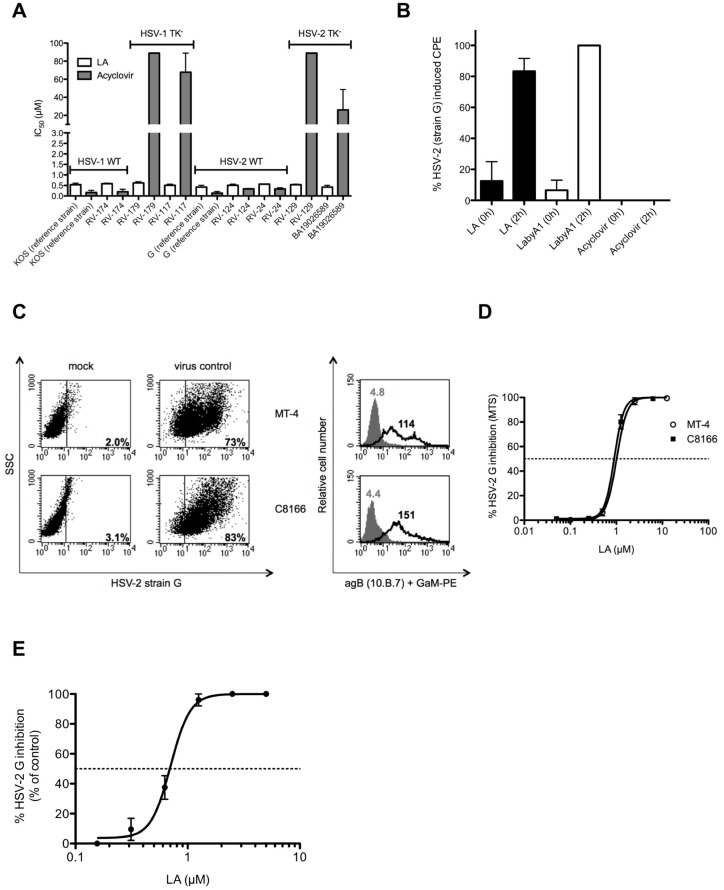
Fig 4. Broad-spectrum anti-HSV-2 activity of LA in epithelial HEL cells, MDDCs and CD4+ HIV-susceptible T cells.
(A) Dose-depedent anti-HSV activity of LA in HEL fibroblasts against wild-type HSV-1 strains [KOS (reference) and RV-174 (clinical isolate)], TK- HSV-1 strains RV-179 and RV-117 (clinical isolates)], wild-type HSV-2 strains [G (reference), RV-124 and RV-24 (clinical isolates)] and TK- HSV-2 strains (RV-129 and BA19026589 (clinical isolates)]. The following IC50s were obtained: 0.53 ± 0.08 μM (KOS strain); 0.59 ± 0.03 μM (RV-174); 0.62 ± 0.06 μM (RV-179); 0.51 ± 0.05 μM (RV-117); 0.42 ± 0.09 μM (strain G); 0.51 ± 0.05 μM (RV-124); 0.56 ± 0.00 μM (RV-24); 0.54 ± 0.02 μM (RV-129) and 0.42 ± 0.09 μM (BA19026589). Mean ± SEM out of 2 independent experiments is shown. (B) HEL cells were infected with HSV-2 G and the compounds [LA (0.5 μM), LabyA1 (9.6 μM) and Acyclovir (10 μM)] were added at the time of infection (0 h) or 2 h post-infection. After 3 days, virus-induced CPE was scored microscopically. Mean ± SEM up to 3 experiments is shown. (C) Infection of HSV-2 G in CD4+ HIV-1 susceptible T cell lines. MT-4-, C8166 T-lymphoma cells were infected with HSV-2 G. Percentage of infected cells is indicated after 3 days (MT-4 cells) or 4 days (C8166 cells) post-infection as detected using the mAb [10.B.7] directed to the HSV-2 envelope glycoprotein B (gB) by flow cytometry. Grey histograms represent the background fluorescence, while the black histograms show virus binding. The mean fluoresence intensity (MFI) values are indicated in each histogram. (D) Dose-dependent anti-HSV-2 G activity of LA in the CD4+ T-lymphoma cell lines MT-4 and C8166 as measured spectrophotometrically. Mean IC50 ± SEM from 5–6 independent experiments is shown. (E) Infection of HSV-2 G in MDDCs. Viral replication was measured 5 days post-infection, relative to the postive control, based on flow cytometry side-scatter analyses. Mean ± SEM of 4 individual donors is shown.

