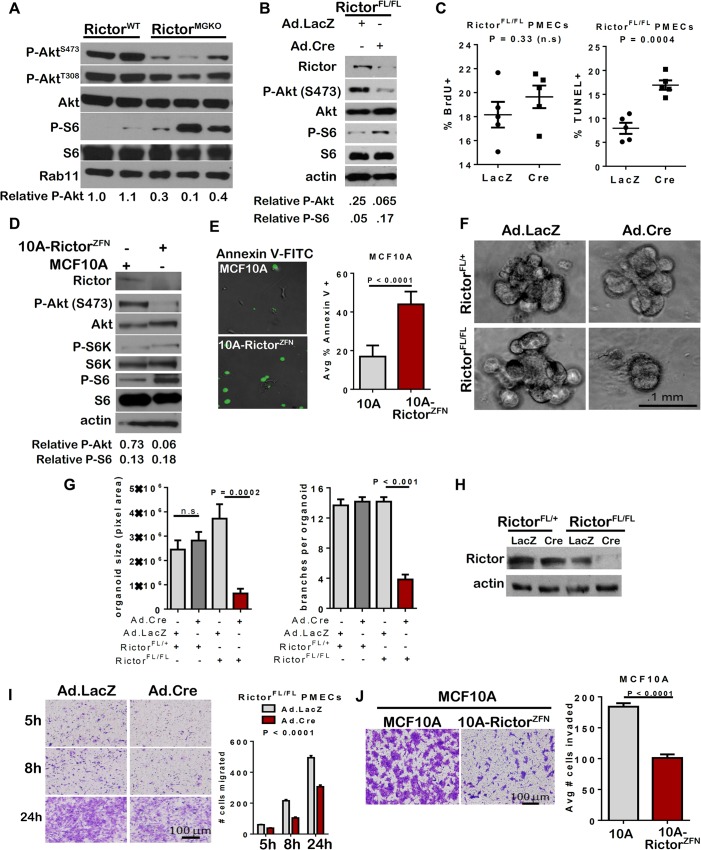
Fig 2. Impaired survival and morphogenesis of mammary epithelial structures upon loss of Rictor ex vivo.
A. Western analysis of whole mammary lysates harvested from 10-week old female mice. B-C. Rictor FL/FL PMECs were infected with Ad.Cre or Ad.LacZ and cultured 7 days. B. Western analysis of PMEC lysates under serum starved conditions. Quantitation was performed using Image J software and numbers represent P-Akt or P-S6 bands normalized to total Akt or S6 levels. C. BrdU+ (left) and TUNEL+ (right) nuclei relative to total nuclei were quantified. N = 5 epithelial isolates, each analyzed in triplicate. Midline values indicate average, whiskers indicate S.D., Student’s T-test. D-E. MCF10A and MCF10A-RictorZFN cells were analyzed. D. Western analysis of MCF10A lysates. E. Cells were labeled with Annexin V-FITC for 6 hours then photographed. Percent Annexin V+ cells versus total was quantified, average ± S.D. shown. N = 3 independent experiments, each analyzed in quadruplicate, representative images shown, Student’s T-test. F-I. Rictor FL/FL PMECs and organoids were infected with Ad.Cre or Ad.LacZ. F. Organoids photographed after 10 days in Matrigel culture. Representative images are shown. G. Average organoid size, measured in pixel area using Image J software, ± S.D. (left panel) and average number of branches/organoid ± S.D. (right panel) are shown. N = 6 independent organoid isolates, analyzed in triplicate, Student’s T-test. H. Western analysis of PMEC lysates. I. Transwell invasion of adenovirus-infected Rictor FL/FL PMECs in response to serum. Cells migrating to the opposite side of the transwell filter were visualized with crystal violet and counted. N = 6 PMEC isolates/condition, one-way ANOVA. J. Transwell invasion of MCF10A and MCF10A-RictorZFN cells in response to serum is shown as average number of invading cells ± S.D. N = 3, independent experiments, each analyzed in triplicate, Student’s T-test.

