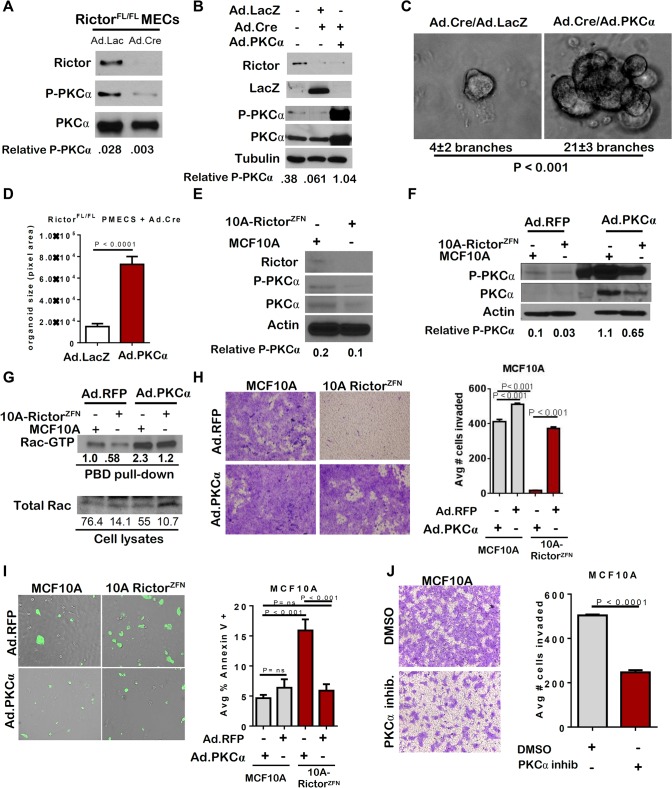
Fig 4. Loss of PKC-alpha-mediated Rac activation in the absence of Rictor.
A-D. Rictor FL/FL PMECs and organoids were infected with the indicated adenoviruses. A-B. Western analysis of PMEC lysates. Quantitation was performed using Image J software and numbers represent P-PKC-alpha bands normalized to total PKC-alpha levels. C. Organoids photographed after 10 days in Matrigel culture. Average number of branches/organoid ±S.D. indicated below panels. N = 3 independent organoid isolates/condition analyzed in triplicate, Student’s T-test. D. Average colony size of organoids measured in pixel area ± S.D. N = 3 independent organoid isolates/condition, analyzed in triplicate, Student’s T-test. E. Western analysis of MCF10A parental and RictorZFN lysates. Quantitation was performed using Image J software and numbers represent P-PKC-alpha band normalized to actin for each sample. F-I. MCF10A parental and RictorZFN cells were infected with Ad.RFP or Ad.PKC-alpha. F. Western analysis of MCF10A parental and RictorZFN lysates, 48 hours post-infection. Quantitation was performed using Image J software and numbers represent P-PKC-alpha band normalized to actin for each sample. G. GST-Pak-PBD effector pull-downs followed by western analysis for Rac performed 48 hours post-infection. Quantitation was performed using Image J software. Numbers in upper panel represent Rac-GTP levels in MCF10A-RictorZFN compared to MCF10A parental control. Lower numbers represent Rac-GTP levels normalized to total Rac for each sample. H. Cells were assessed for invasion through Matrigel-coated transwell filters. Cells were stained with crystal violet after 24 hours, and then imaged. Number of cells invading was quantitated in Image J. Values shown represent the average ± S.D., Student’s T-test. N = 2 independent experiments, analyzed in triplicate. I. Cells were assessed for Annexin V-FITC. Number of Annexin V-FITC+ per total number of cells was quantitated in Image J, Student’s T-test. N = 2 independent experiments, analyzed in triplicate. J. MCF10A parental cells were assessed for invasion through Matrigel-coated transwell filters in the presence of PKC-alpha inhibitor GO6976. Cells were stained with crystal violet after 24 hours, and then imaged. Number of cells invading was quantitated in Image J. Values shown represent the average ± S.D., Student’s T-test. N = 2 independent experiments, analyzed in quadruplicate.

