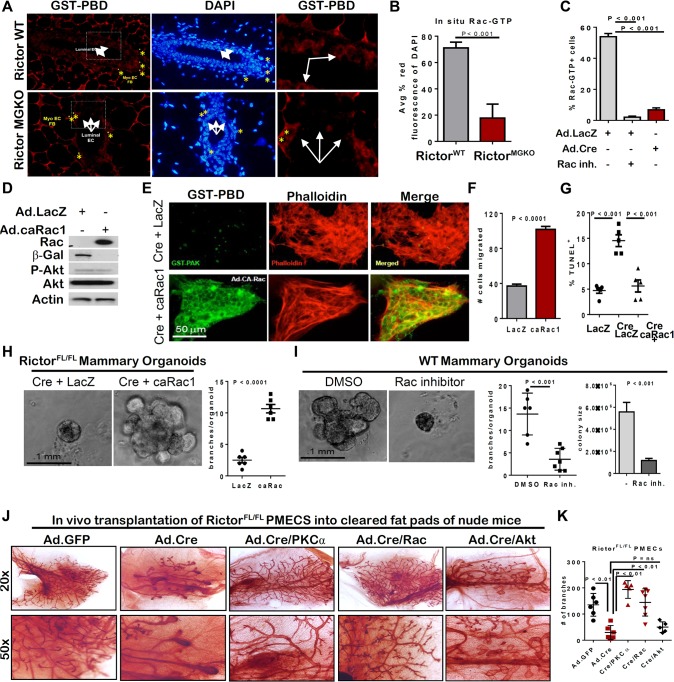
Fig 5. Rictor-mediated Rac activity is necessary and sufficient for mammary branching morphogenesis ex vivo.
A. In situ detection of GTP-bound Rac via IF detection of GST-PBD (red; nuclei stained with DAPI, blue) on mammary gland sections from 6-week old mice. N = 6 independent fields analyzed in sections from 3 independent mammary gland sections/genotype. B. Quantitation of average percent red fluorescence (Rac-GTP) relative to blue (DAPI) on mammary gland sections from 6 week old virgin Rictor WT and Rictor MGKO mice, ± S.D., Student’s T-test. C. Cells were probed with GST-PBD (red) and counterstained with DAPI (blue). GST alone (not conjugated to PBD) was used as a negative control. GST-PBD+ fraction of total PMECs was counted and average ± S.D. shown. N = 15 fields/condition, Student’s T-test. D-I Rictor FL/FL PMECs infected with Ad.Cre or Ad.LacZ (±Ad.caRac1) and analyzed. D. Western analysis of PMEC lysates. E. Cells were probed with GST-PBD (green) and counterstained with phalloidin (red). F. Transwell invasion assays were performed. Invading cells were visualized with crystal violet and counted ±S.D. N = 6 independent isolates, analyzed in duplicate, Student’s T-test. G. PMECs were assessed by TUNEL analysis. N = 3 independent cell isolates, analyzed in duplicate. Representative images shown. Average percent TUNEL+ nuclei per total epithelial nuclei quantified. Midline values indicate average, whiskers indicate S.D., Student’s T-test. H. Rictor FL/FL organoids were infected Ad.Cre or Ad.LacZ (±Ad.caRac1) prior to embedding, and were photographed after 10 days in Matrigel culture. Right panel shows average number of branches per organoid. Each data point is the average branches per colony from individual isolates, analyzed in triplicate. Midlines are the average of all isolates, whiskers indicate S.D., Student’s T-test. N = 6. I. WT organoids were cultured ±Rac inhibitor for 10 days. Number of branches per organoid quantified. Each data point is the average branches per colony from individual isolates, analyzed in triplicate. Midline values indicate average, whiskers indicate S.D., Student’s T-test. Student’s T-test. Right panel shows average organoid size ±S.D. J-K. PMECs from Rictor FL/FL mice were tranduced with control Ad.GFP versus Ad.Cre in the presence or absence of Ad.PKC-alpha, Ad.caRac, or Ad.Aktmyr. PMECs were transplanted into the cleared inguinal fat pads of 4 week old recipient female mice. Mammary glands were harvested six weeks post-transplantation and epithelial architecture and branching morphogenesis in whole-mount preparations was assessed. J. Whole-mount preparations from indicated transplanted glands. K. Quantitation of average number of branches ± S.D., Student’s T-test. Representative images shown from N = 2 independent experiments.

