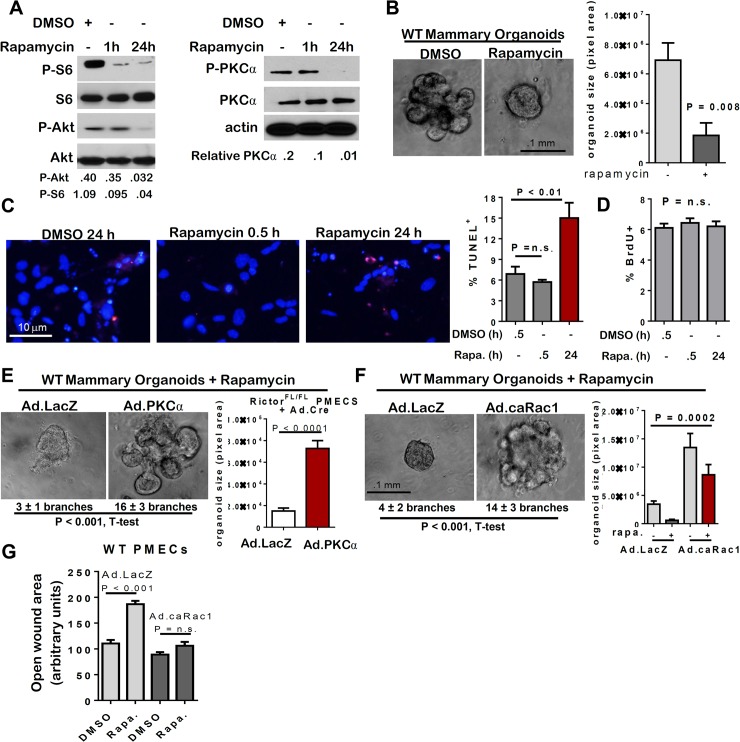
Fig 6. mTOR inhibition with rapamycin decreases MEC survival and branching.
A-G. WT PMECs and organoids were cultured in DMSO vehicle or rapamycin. PMECs were cultured 0, 0.5, or 24 hours. Organoids were cultured 10 days in Matrigel in the presence of DMSO or rapamycin. A. Western analysis of PMEC lysates. Quantitation was performed using Image J software and numbers represent P-Akt, P-S6, or P-PKC-alpha bands normalized to total Akt, S6, or PKC-alpha levels. B. WT organoids photographed after 10 days in Matrigel culture. Average organoid size scored as average pixel area ± S.D., Student’s T-test, N = 6 epithelial isolates, each analyzed in triplicate. C. TUNEL analysis of PMECs. Average percent TUNEL+ nuclei per total PMEC nuclei ± S.D. is shown, Student’s T-test. N = 3 independent cell isolates, analyzed in duplicate. D. PMECs were labeled with BrdU after initial pre-treatments with rapamycin for 0.5 hours or 24 hours. Average percent BrdU+ nuclei per total nuclei ± S.D. is shown, One-way ANOVA, N = 3 independent cell isolates, analyzed in triplicate. E-F. Organoids were infected with Ad.LacZ or Ad.PKC-alpha (panel E) or Ad.caRac1 (panel F) prior to embedding in Matrigel plus rapamycin or DMSO. Average number of branches/colony is shown below each image. Average organoid size scored as average pixel area ± S.D., Student’s T-test (E) and one way ANOVA (F), N = 6 epithelial isolates, each analyzed in triplicate. G. Confluent PMEC monolayers were scratch-wounded, cultured in rapamycin or DMSO, and imaged at 24 hours. Total wounded area remaining after 24 hours was measured. Values shown are the average wound area remaining ± S.D. N = 3 independent cell isolates, analyzed in triplicate.

