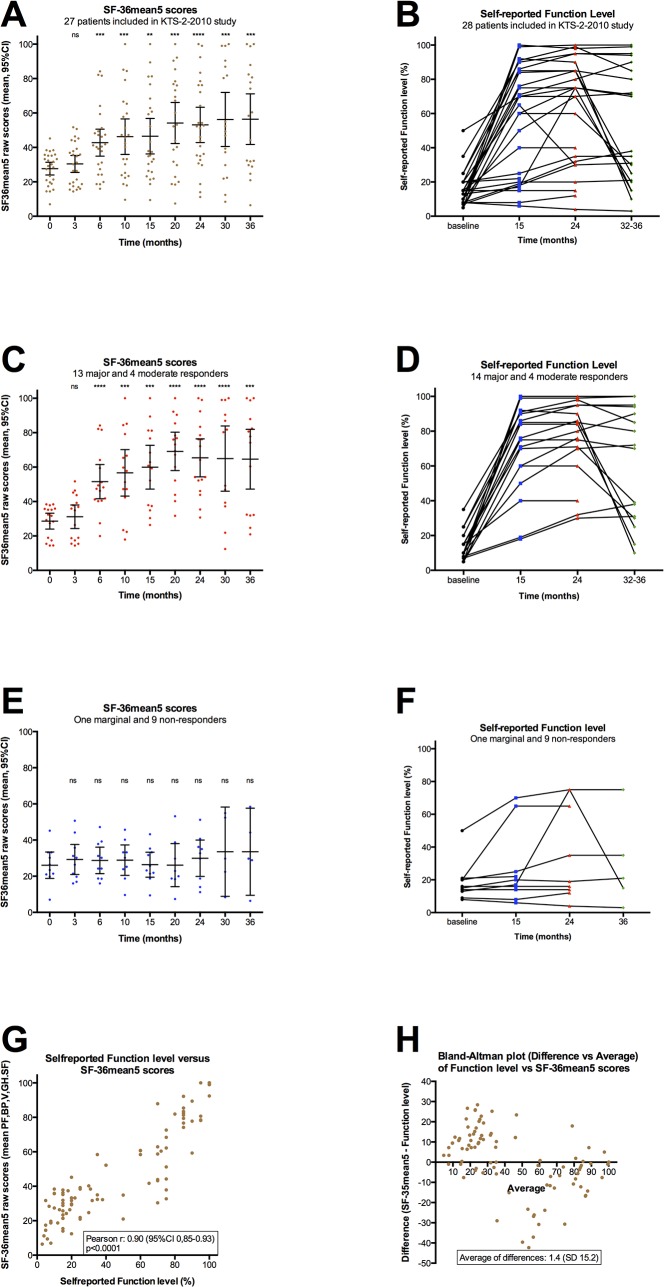
Fig 6. Function level and “SF-36mean5”.
Mean values of SF-36 raw scores for the five subdimensions Physical function (PF), Bodily pain (BP), Vitality (V), Social function (SF) and General health (GH) are shown (denoted “SF-36mean5”, scale 0–100), at baseline and at 3, 6, 10, 15, 20, 24, 30 and 36 months follow-up. SF-36mean5 scores for each time point during follow-up were compared to baseline scores. P-values were calculated using Repeated Measures One-way ANOVA, with Dunnett’s multiple comparison adjustments, and are indicated at the top of each panel. ns: not significant; **: p<0.01; ***: p<0.001; ****: p<0.0001. To be able to analyze for differences at each time point relative to baseline, a missing value at a time point for a patient was replaced with value interpolated between the previous and next values during follow-up for that patient (but not replaced in the plot). Panel A shows “SF-36mean5” (raw) scores for 27 patients in this study. One pilot patient did not fill in SF-36 forms. In addition 22/243 (9.1%) data were missing, including for patients out of study before end of follow-up, as explained in M&M. Panel C shows “SF-36mean5” scores for 17 patients with clinically significant response (data from pilot 2, and in addition 10/153 (6.5%) data were missing). Panel E shows “SF-36mean5” scores for 10 patients with no clinically significant response during follow-up (12/90 (13.3%) data were missing). Panels B, D and F show self-reported Function levels (according to a form with examples, see S3 Fig), at baseline and at 15, 24 and 36 months. In panel B for 28 patients included in the KTS-2-2010 study, in panel D for 18 patients with clinically significant responses, and in panel F for 10 patients without clinically significant responses. In panels B and D, two moderate responders registered their Function level at 32 and 33 months (instead of 36 months), respectively. Panel G shows a correlation plot between “SF-36mean5” raw scores and self-reported Function levels (both with scale 0–100), with pooled data from baseline and at 15, 24 and 36 months follow-up. Panel H shows a Bland-Altman plot for difference (“SF-36mean5”—Function level) versus average.

