
Fig 7. CD19+ B-lymphocytes in peripheral blood during follow-up.
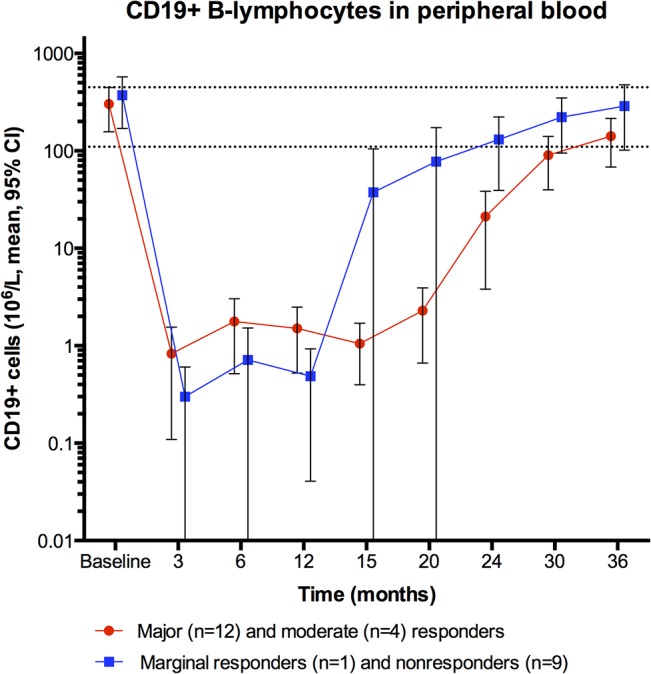
B-lymphocyte numbers from immunophenotyping of peripheral blood during follow-up are shown, at baseline and 3, 6, 12, 15, 20, 24, 30 and 36 months follow-up. The red dots represent mean value at each time point, for patients with either major or moderate clinical response (n = 16). The blue squares denote the mean values for patients with no significant response (n = 10). The value zero for B-lymphocytes in peripheral blood was substituted by 0.1 (to enable plotting on the log scale). B-lymphocyte counts x 106/L (normal range 110–449). The error bars denote mean ± 95% CI. B-cell data during follow-up were not available for the two pilot patients (both major responders). According to an amendment, seven patients received further rituximab infusions in addition to the six infusions stated in the initial protocol. Two major responders received five and four rituximab additional rituximab infusions, respectively. Four moderate responders received five, four, three and three additional rituximab infusions. One non-responder received two additional rituximab infusions.