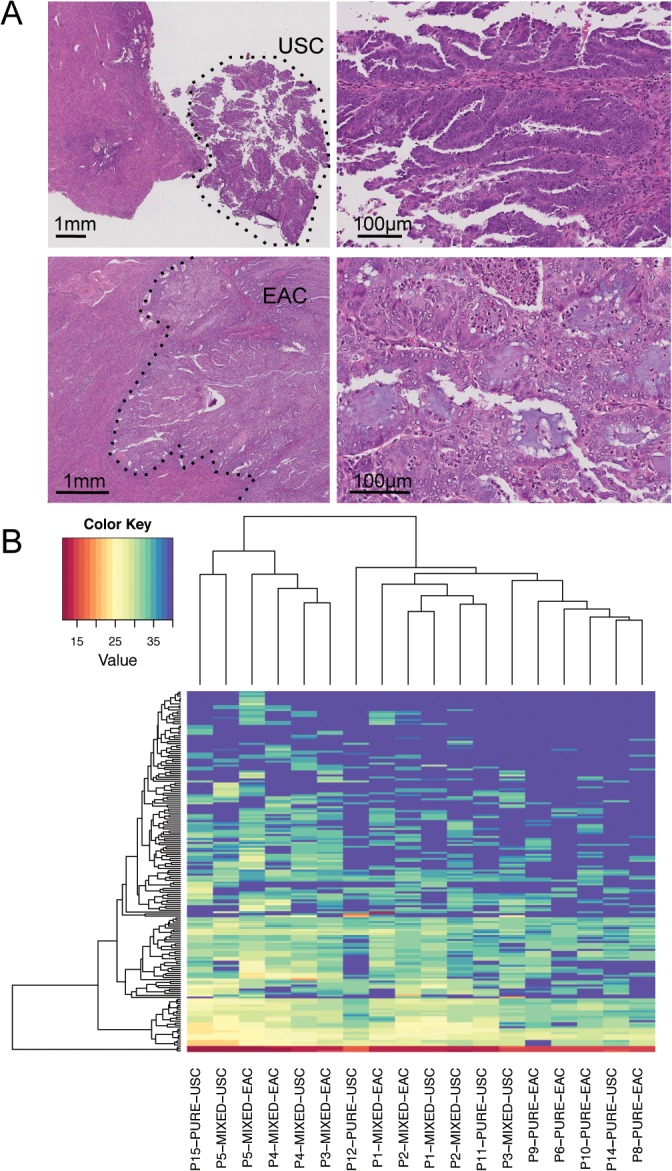
Fig 1. Molecular analysis of pure and mixed macrodissected endometrial cancers.

(A). Gene expression profiling of MT-EC. H&E stained sections of USC and EAC region within an MT-EC (Patient 5). Low power images are shown on the left, the dashed line indicates the region macrodissected for molecular analyses. Representative high power images of the respective histologies are shown on the right. (B) Gene expression profiling of MT-EC. Unsupervised hierarchical clustering of macrodissected pure and mixed EC cases, based on the expression of a panel of 60 candidate genes. Pure EAC cases tend to cluster together; similary pure USC cases cluster together. Macrodissected regions of mixed cases also cluster together, with mixed cases more closely related to pure USCs.
