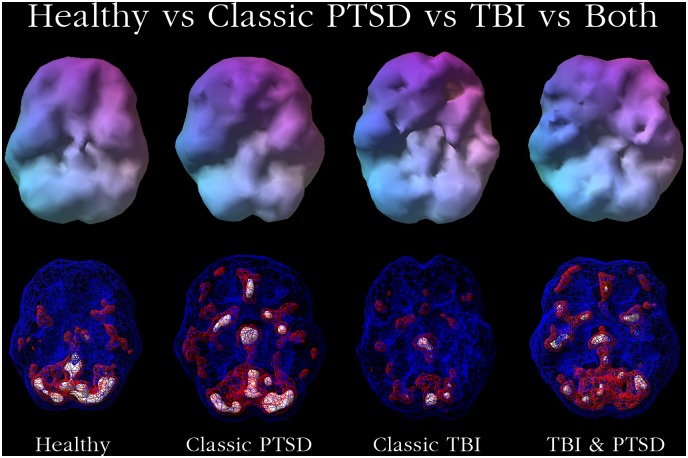
Fig 3. Brain SPECT Images of Healthy, PTSD, TBI and PTSD Co-morbid with TBI Perfusion Patterns.
Top row, underneath surface scans, threshold set at 55%, looking at top 45% of brain perfusion. Bottom row, underneath active scans where blue = 55%, looking at top 45% of brain perfusion, red = 85% and white 93%. Healthy shows full even, symmetrical perfusion with most active area in cerebellum. Classic PTSD shows increased anterior cingulate, basal ganglia and thalamus perfusion. Classic TBI shows multiple areas of low perfusion seen on surface scans (top row). TBI and PTSD show both.

