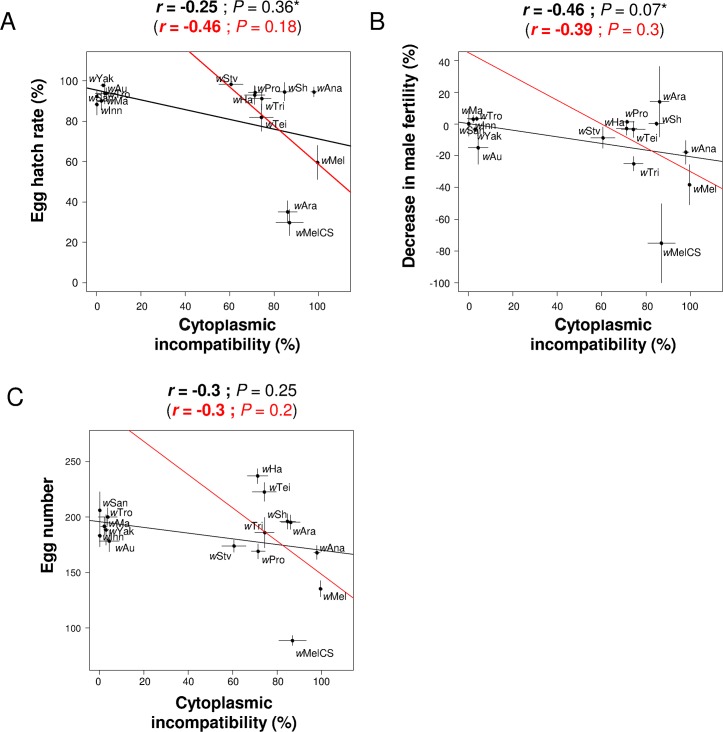
Fig 4. Correlations between CI and other host life-history traits.
The level of CI is correlated with (A) the egg hatch rates in crosses with Wolbachia-free males, (B) the decrease in male fertility and (C) the egg number. Means and standard errors are shown. Solid lines show predicted values from linear regressions using all strains (black) or only CI-inducing strains (red). r is the Pearson’s or Spearman’s (*) correlation coefficient between traits.

