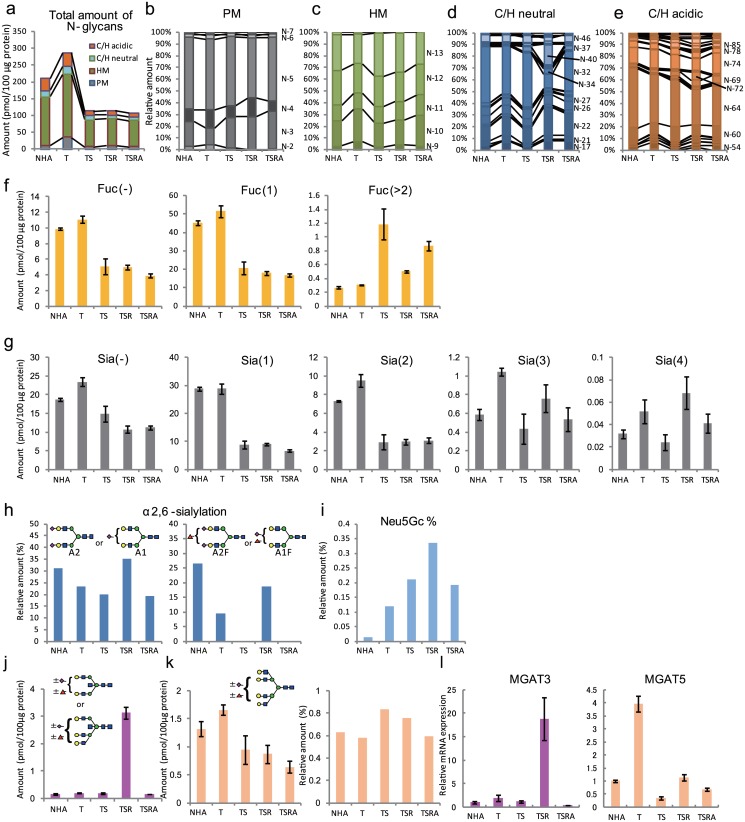
Fig 4. Cellular N-glycomes.
Quantified N-glycans were structurally classified as PM-, HM-, and C/H-type glycans (a). PM- (b), HM- (c), C/H neutral- (d), and C/H acidic-type glycans (e) were further compared according to composition. Glycan classifications were performed based on the estimated glycan structures and compositions shown in S6–S10 Tables. Fucosylation and sialylation status of C/H-type N-glycans (f and g). (h) Proportion of α2,6 sialic acids among total sialic acids with A2 and A1 (left) and A2F and A1F (right). (i) Relative levels of N-glycans showing N-glycolylneuraminic acid incorporation among total sialylated N-glycans. Expression profiles of glycans with bisecting GlcNAc residues (j) and tetra-antennary glycans (k). (j) Sum of the expression levels of all glycans having (Hex)2(HexNAc)3 or (Hex)3(HexNAc)4 substructures were compared among NHA, NHA/T, NHA/TS, NHA/TSR, and NHA/TSRA cells. (k) Sum of the expression levels of all glycans having (Hex)4(HexNAc)4 as a substructure was compared among the different cell types. Left; absolute amounts, right: relative abundance of tetra-antennary glycans among C/H-type glycans. (l) Real-time PCR analysis of MGAT3 (left) and MGAT5 (right) expression levels. Each value represents the mean ± the standard deviation (SD) of three independent MALDI-TOF MS (f, g, j, and k) or real-time PCR analyses (l).

