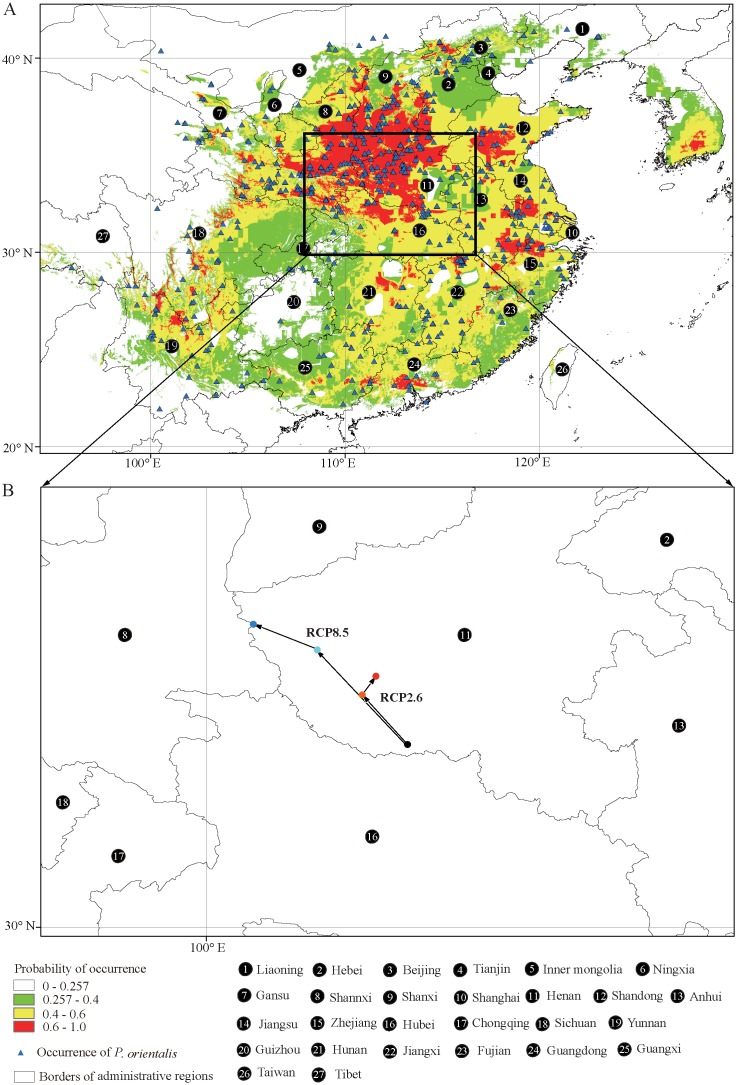
Fig 1. Current species distribution model and the core distributional shifts under different climate scenario/year for Platycladus orientalis.
A, The occurrence and current species distribution model (SDM) for Platycladus orientalis. B, the core distributional shifts under different climate scenario/year combination. Black dot indicates the geometric center of suitable area under current climate condition; orange dot and red dot indicate the geometric centers of future suitable areas of 2050 and 2070 under the climate scenario of RCP2.6; wathet dot and blue dots indicate the geometric centers of future suitable areas of 2050 and 2070 under the climate scenario of RCP8.5, and the arrows depicting magnitude and direction of predicted change through time.

