
Fig. 2.
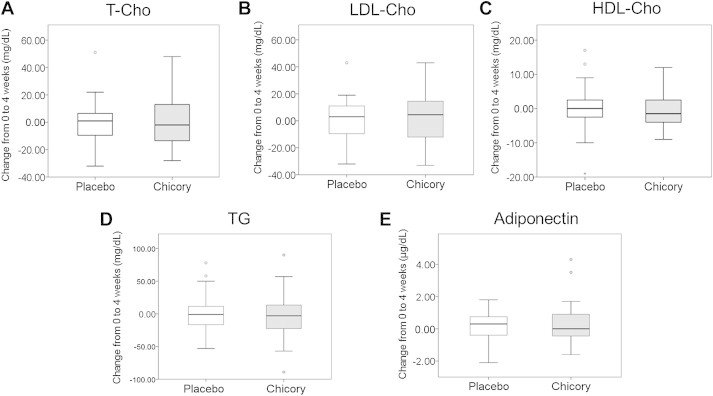
Changes in the level of lipid metabolism parameters from the baseline to the end of the intervention. (A) Total cholesterol (T-Cho). (B) Low-density lipoprotein-cholesterol (LDL-Cho). (C) High-density lipoprotein-cholesterol (HDL-Cho). (D) Triglyceride (TG). (E) Adiponectin. Values are means ± standard error.