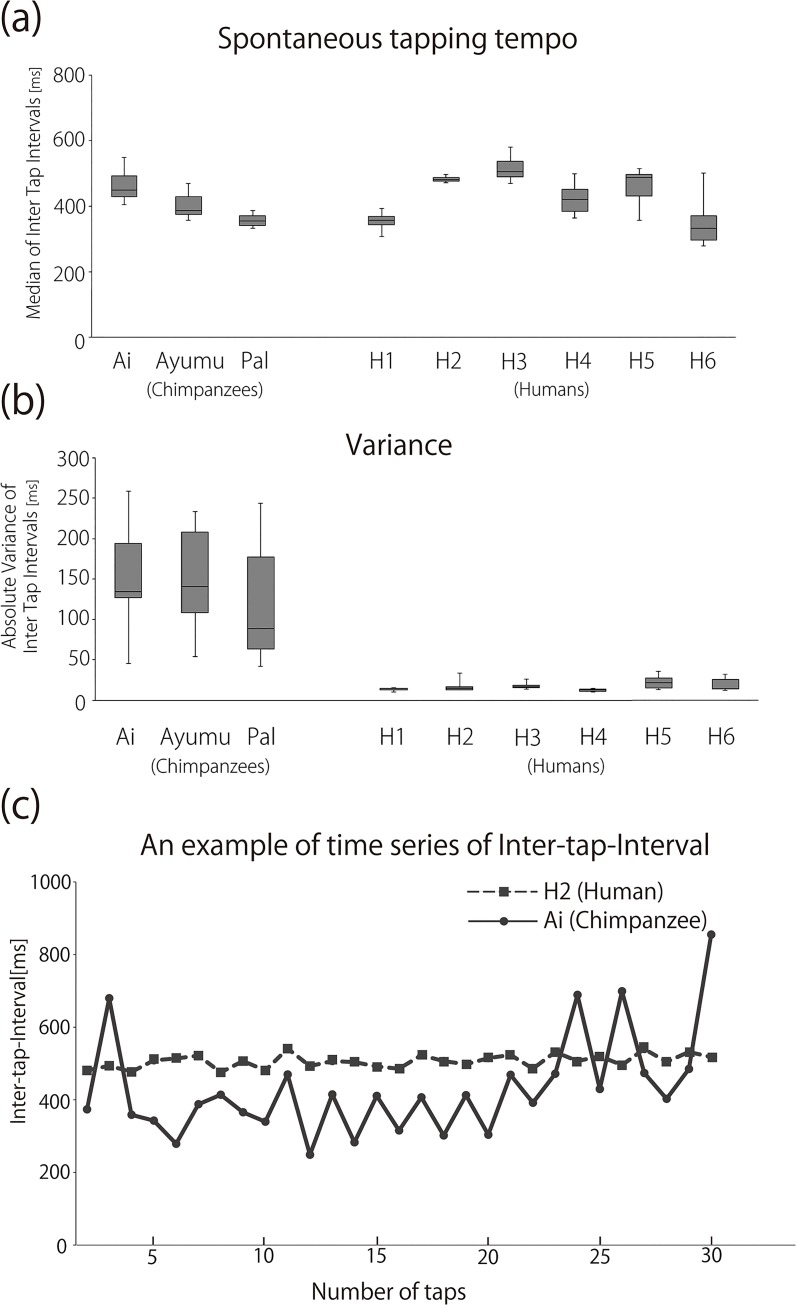
Fig 3.
(a) Median inter-tap-intervals and (b) average of absolute variance of chimpanzees and human participants in ‘no stimulus’ condition. The figure shows the average (crossbar), the range from the 25th to 75th percentiles (shaded box), and the minimum and maximum values (thin line). (c) An example of time series of inter-tap-interval by Ai (chimpanzee) and H2 (human). Tapping data was taken from the 1st trial of the ‘no stimulus’ condition.

