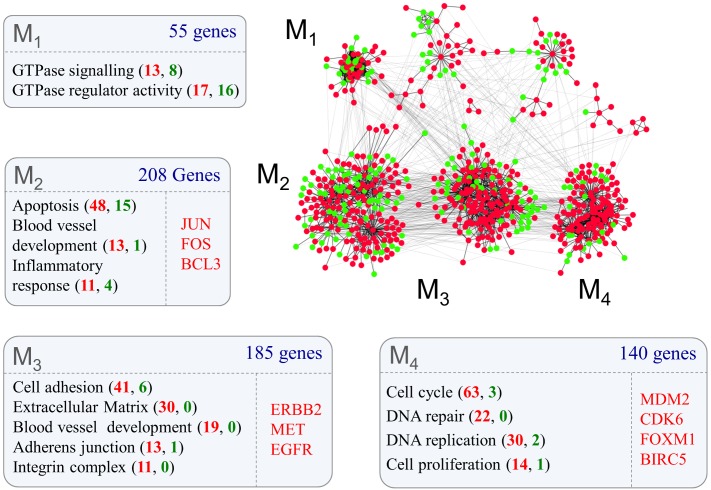
Fig 2. Protein-protein interaction networks representing glioma grade transition reveal functionally distinct modules.
Proteins for which mRNA abundance is higher (red nodes) or lower (green nodes) in grade IV glioma form highly interconnected modules (network modules M1-M4) defined by known protein-protein interactions. Gene ontology analysis of each module (box M1-M4) reveal functional terms enriched within clusters (false discovery rate < 10%). The number of genes mapped to each Gene Ontology term is shown in brackets and are coloured red if they are up or green if they are down-regulated in grade IV glioma. Individually listed genes are known cancer oncogenes within each cluster, of which all were up-regulated in grade IV glioma.

