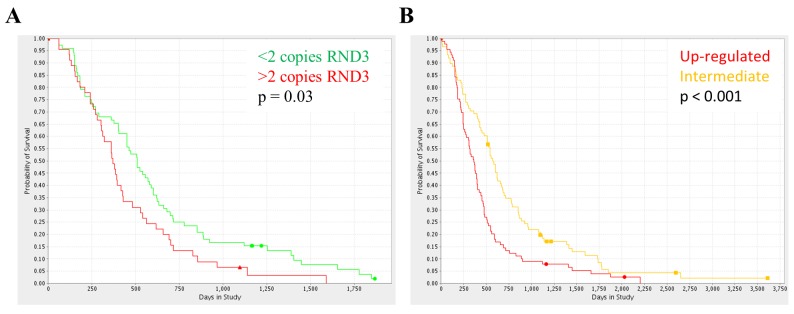
Fig 7. RND3 expression and copy number variation is a significant risk factor for glioma patients.

A. The Kaplan-Meier survival curves for glioma patients with amplification (red, n = 45) or deletion (green, n = 72) of the RND3 locus, determined from SNP frequency data within the REMBRANDT database, log rank p value = 0.0301. B. The Kaplan-Meier survival curves for glioma patients with RND3 overexpression (red, n = 89) or comparable expression (orange, n = 88) versus non-tumour samples, log rank p value = 0.0006. All analysis performed using the online REMBRANDT database tools.
