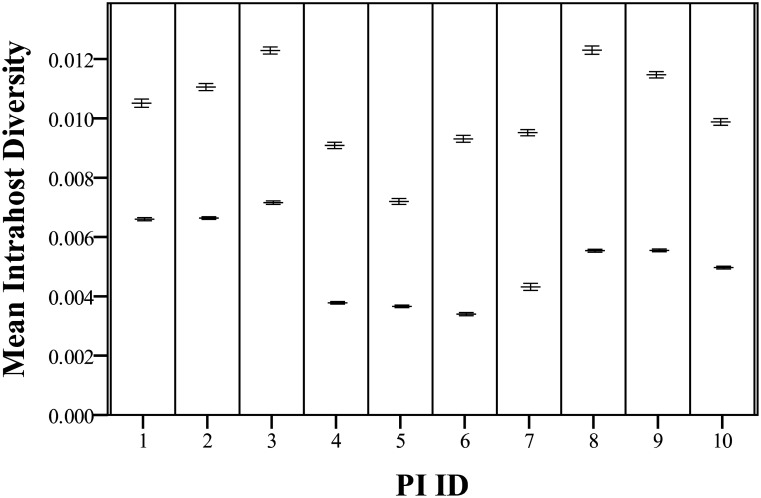
Fig 1. Mean total intrahost E2 (upper bar) and NS5B (lower bar) distances for each PI animal.
Distance are based on a minimum of 70 sequences per gene per animal. Horizontal bars indicate the mean distances and the error bars represent the standard error of the mean (SEM). See S2 Table for the exact values.

