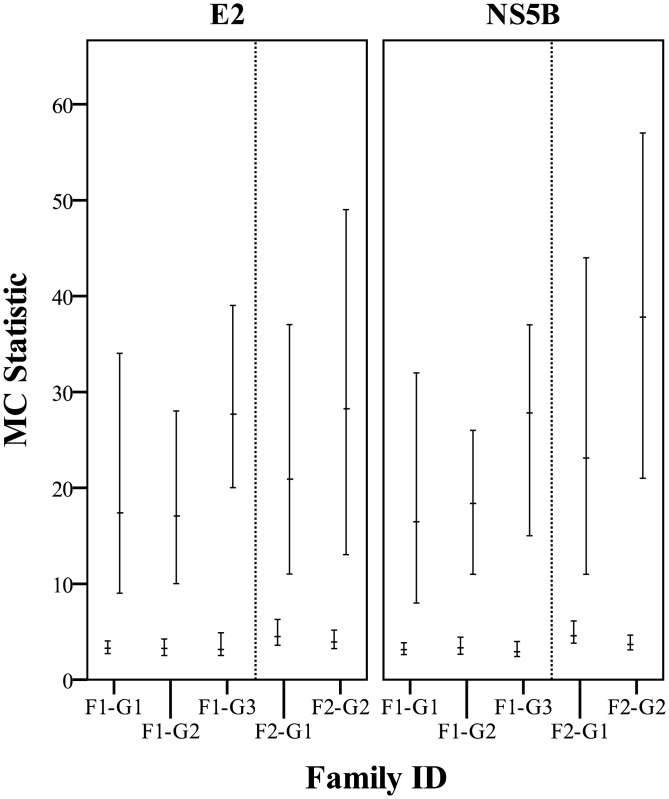
Fig 6. MC test and null distributions calculated with Befi-BaTS for each member of the PI families.
Mean MC values are indicated by horizontal bars with the 95% confidence intervals of the null (lower bars) and test (upper bars) distributions indicated by the bars. All differences between null and test distributions are statistically significant as indicated by non-overlapping confidence intervals.

