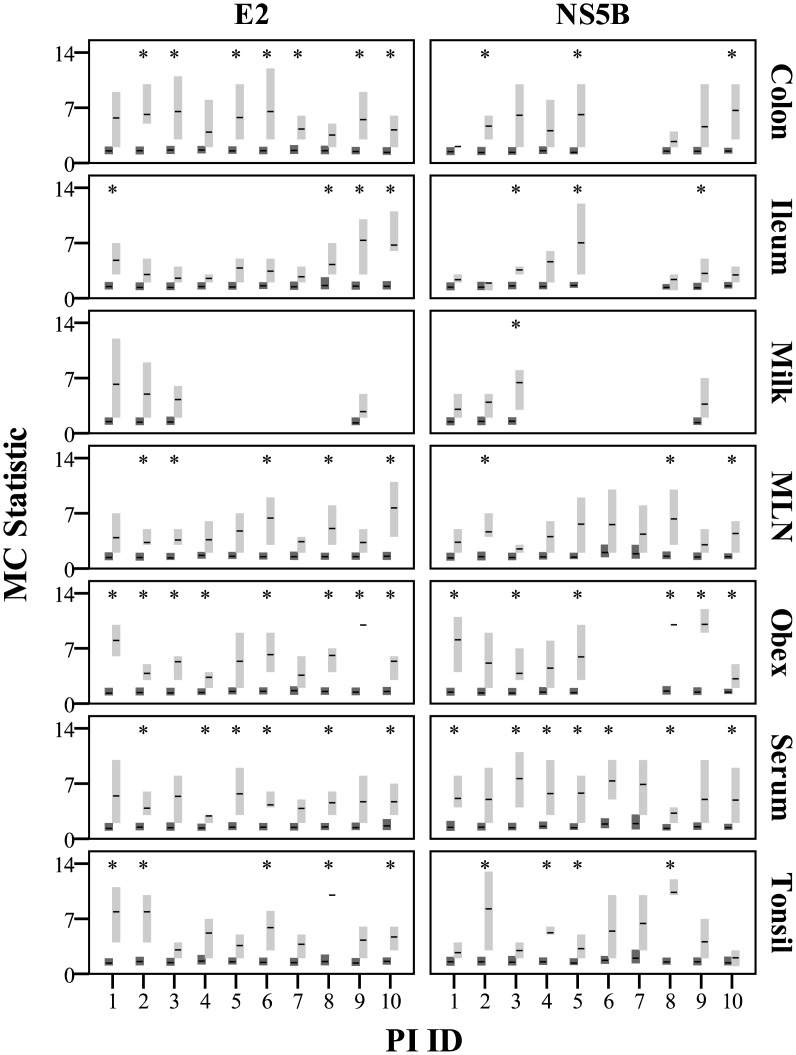
Fig 7. MC test and null distributions calculated with Befi-BaTS for each tissue compartment of each PI animal.
Mean MC values are indicated by horizontal bars with the 95% confidence intervals of the null (dark grey) and test (light grey) distributions indicated by the vertical bars. Cases where the test and null distributions are significantly different and do not overlap have been marked with *.

