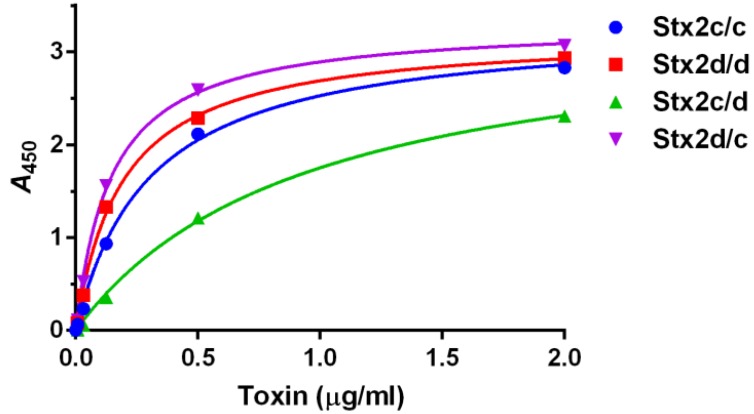
Figure 2.
Binding of toxins to Gb3. An ELISA was used to assess binding of each toxin to purified Gb3. Mean and standard deviation values were plotted from triplicate values. The nonlinear curve was approximated by “One Site–Specific Binding” within GraphPad Prism (see Materials and Methods) and the r2 > 0.99 for all toxins curves. An F test to compare the Kd values indicated that they were different, p < 0.0001, and pairwise comparisons gave a value of p ≤ 0.0001. The apparent Kd values (rounded to the nearest 0.01) for Stx2c/c, Stx2d/d, Stx2c/d, and Stx2d/c, were 0.30 µg/mL with a 95% CI of 0.26–0.35 µg/mL, 0.19 µg/mL with a 95% CI of 0.17–0.21 µg/mL, 0.95 µg/mL with a 95% CI of 0.82–1.1 µg/mL, and 0.15 µg/mL with a 95% CI of 0.13–0.16 µg/mL, respectively. The Bmax values were similar for each toxin and ranged from 3.2 to 3.4.

