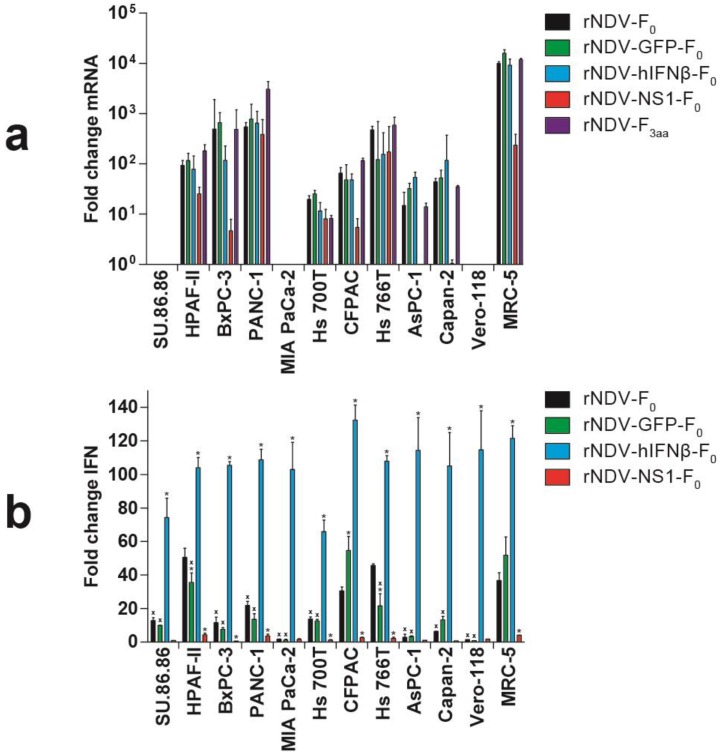
Figure 3.
IFN responses upon inoculation with rNDVs. Cells were either mock inoculated or inoculated with the indicated rNDV at m.o.i. 3. After 24 h: (a) RNA was isolated and quantitative real-time polymerase chain reaction (qRT-PCR) was performed for endogenous hIFNβ mRNA. Results are presented as fold change gene induction of treated versus mock treated cells calculated using the 2−ΔΔCT method [31]. Means and ranges of triplicate experiments are plotted; (b) Supernatants were tested for functional IFN protein content using an ISRE-luc bioassay [14]. Results are presented as fold change in luminescence compared to mock inoculated cells. Means and standard deviations of triplicate experiments are plotted. x = p < 0.05 vs. MRC-5 (one-way ANOVA + Bonferroni post-test), * = p < 0.05 vs. rNDV-F0 (one-way ANOVA + Bonferroni post-test).

