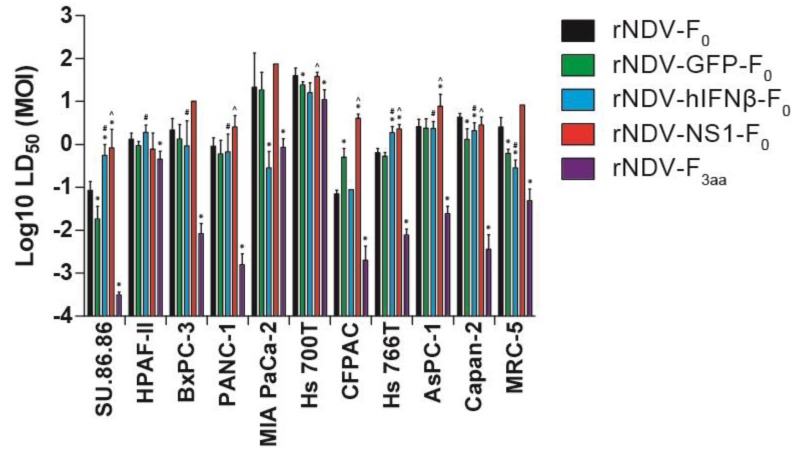
Figure 4.
Median LD50 upon inoculation with rNDVs. Cells were either mock inoculated (not shown; set as 100% viable) or inoculated with rNDV at different m.o.i. (range 0.0001–100). Cytotoxicity was measured after 5 days by LDH assay and LD50 values were calculated. Means and ranges of LD50 calculations are plotted. * = p < 0.05 as compared rNDV-GFP-F0, rNDV-hIFNβ-F0 and rNDV-F3aa compared to rNDV-F0. # = p < 0.05, rNDV-F3aa compared to rNDV-hIFNβ-F0. ^ = p < 0.05 rNDV-F3aa compared to rNDV-NS1-F0.

