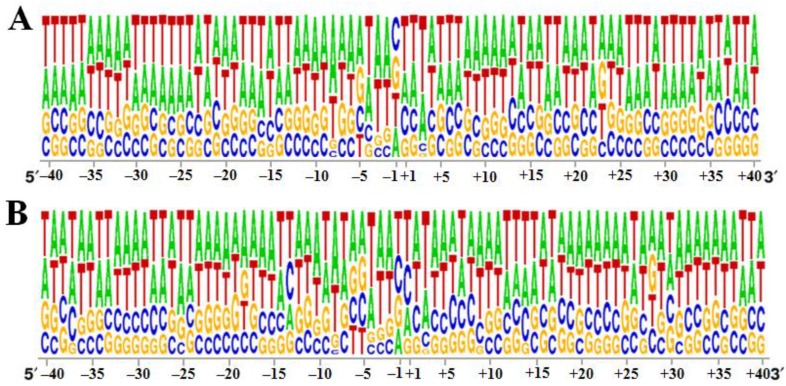
Figure 2.
Base frequency within 40 bp around the integration site of EIAVFDDV13 in the horse genome. (A) Ssp I-digested horse genome; (B) Dra I-digested horse genome. The diagrams were generated using the WebLOGO program (Available online: http://weblogo.berkeley.edu/). The relative lengths of the nucleotides on the Y-axis represent the frequency of each base.

