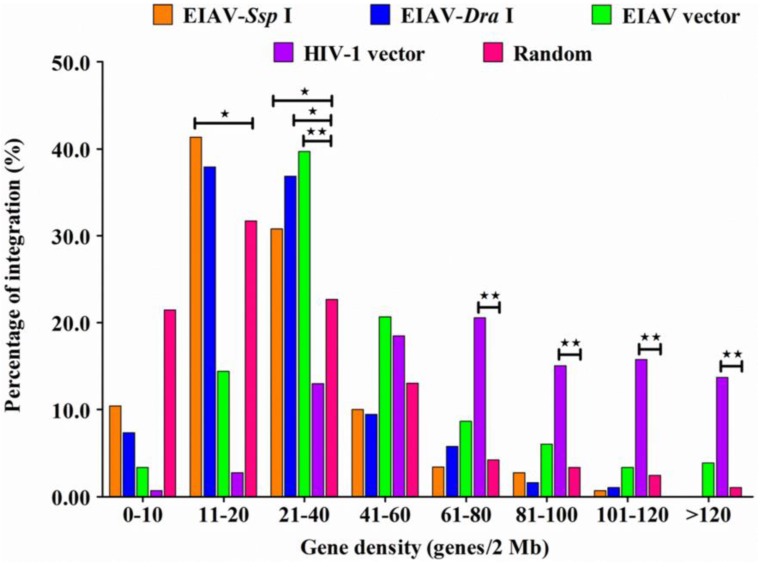
Figure 4.
Gene density within a 2 Mb window centered on the insertion site was determined and classified into eight groups (0–10, 11–20, 21–40, 41–60, 61–80, 81–100, 101–120, >120). The percentage of integration within each group was calculated. The number of integration sites analyzed in the Ssp I and Dra I group was based on the horse genome; and the HIV-1 and EIAV vector group was based on the human genome. The chi-squared test was used. * indicates significant, i.e., p < 0.05; ** indicates very significant, i.e., p < 0.01.

