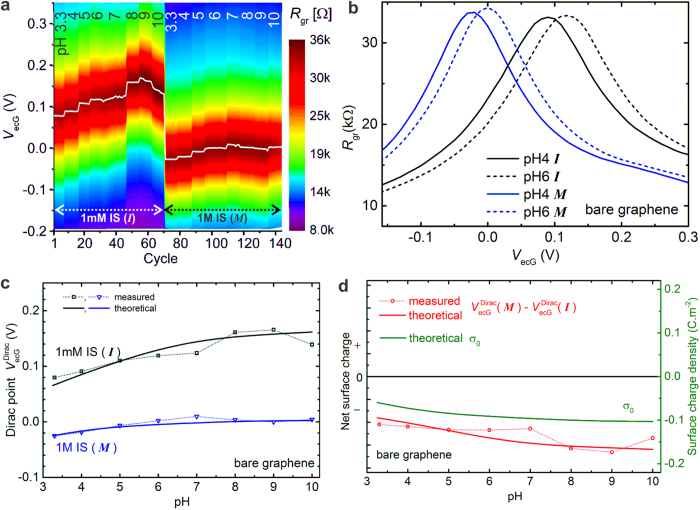
Figure 2. The isoelectric point of bare (unmodified/as-prepared) graphene.
(a) A 2D-map showing the evolution of gate dependence of graphene resistance (Rgr) as a function of varying pH and ionic strength (I − 1 mM, M − 1 M ionic strength; e.g. 6I refers to a pH 6 solution of 1 mM ionic strength). Every cycle takes around 10 s. The measurement is paused during solution exchange. VecG refers to electrochemical gate voltage applied through a Ag/AgCl reference electrode that is in contact with solution. The white profile superimposed on the 2D-map indicates the position of the Dirac point estimated from the profiles such as in (b). (b) Line profiles extracted from the 2D-map showing the gate dependence of graphene resistance in four different solutions, where the shift in Dirac point is discernible. (c) Measured and calculated Dirac point profiles as a function of pH at 2 different ionic strength values. (d) (red curves) measured and calculated difference Dirac curves obtained by subtracting the curve at 1 mM IS from that at 1 M IS (referred to as M − I). For comparison, the calculated surface charge density as a function of pH (green curve) is also superimposed. The difference curve is used as a measure to infer the sign of net surface charge on graphene. The simulated curves were obtained by assuming a pI of 2.0. See supplementary details for more information on model parameters.

