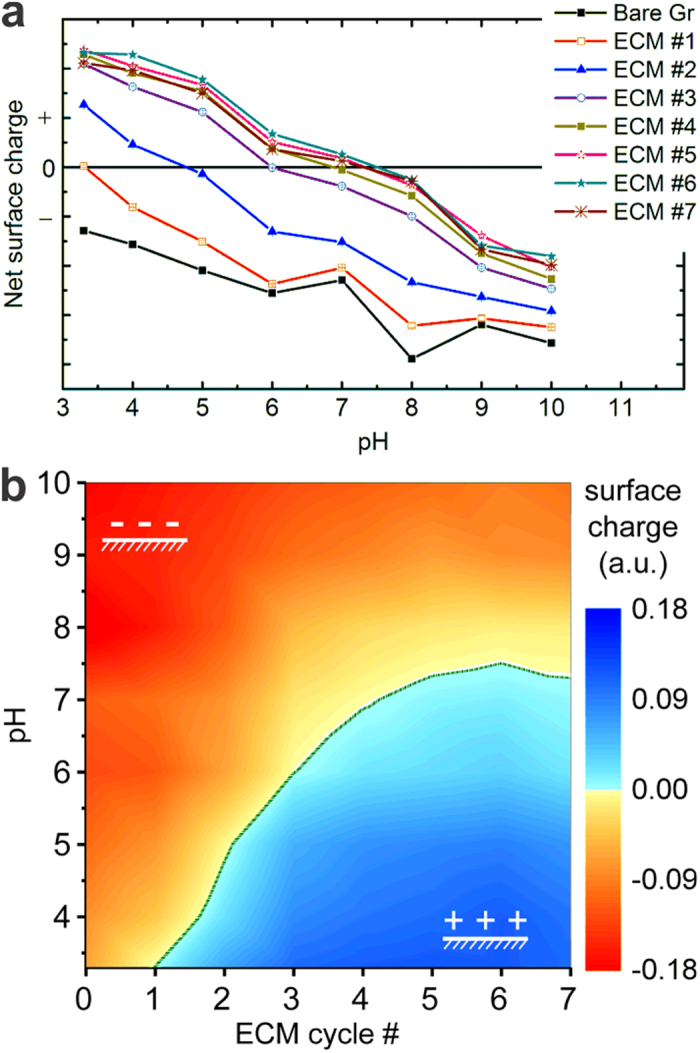
Figure 6. Tuning the isoelectric point of graphene by consecutive electrochemical modification (ECM) using 4-aminobenzylamine.

The difference Dirac curves before and after every ECM are plotted as a function of pH in (a), while the same curves are shown in (b) as a 2D-map in order to exemplify the evolution of the isoelectric point. The IEP occurs along the green line between the blue and orange regions and could be varied from less than 3 up to slightly more than 7 in this case. With every ECM, the density of attached groups increases and leads to a modulation of the surface charge. (b) gives a clear picture of the surface charge being negative in the orange region, and positive in the blue region allowing us to identify the set of parameters needed to obtain a desired pI within the tunable range. (see Fig. S10 for raw Dirac point profiles).
