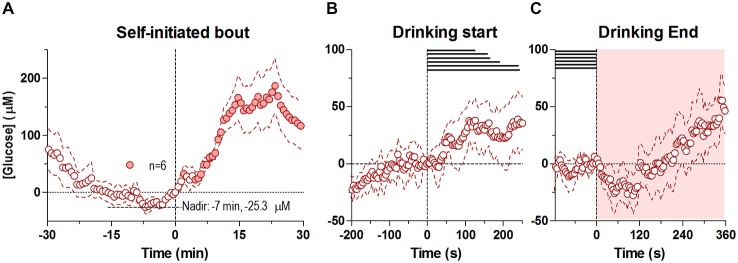
Figure 2.

Dynamic changes in NAc extracellular glucose during the self-initiated drinking bout. Panel (A) shows overall changes for 30 min before and after the entire second, self-initiated bout (30-s bins), where there was a significant change in [glucose] for the entire analysis interval (F(5,450) = 8.44, p < 0.05). Individual points significantly different from the [glucose] nadir (7 min before the onset of drinking, −25.3 μM), are shown as filled symbols. (B,C) show rapid changes in glucose (4-s bins) after the start and end of self-initiated drinking, respectively. While there was no significant change in [glucose] after the start of drinking, there was a significant increase overall after the end of drinking (F(5,450) = 5.50, p < 0.05). No individual point in (C) was significantly different from baseline. Durations of drinking in each subject are shown as horizontal lines in (B,C), shaded areas represent the duration of the main effect on each graph. Due to technical complications, one subject was removed from this analysis (n = 6).
